Other Infographics
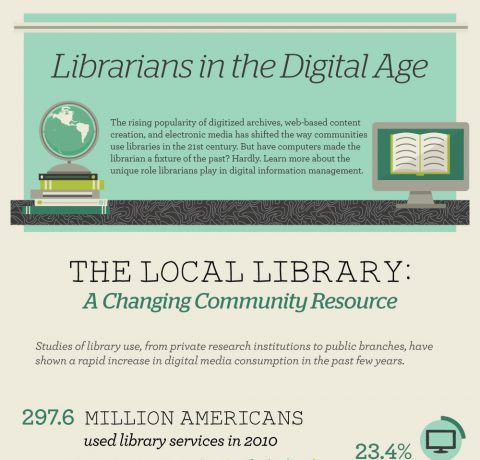
The Role of Librarians In The Digital Age Infographic
Posted on January 19, 2014
There is no doubt that technology has had a lasting impact on libraries. Once thought to be going the way of traditional bookstores, libraries have rebounded and are thriving in a technology fueled world. With the help of innovation, re-imagination and vision, libraries are embracing new technologies while creating dynamic community centers filled with life. […]
 Teacher Infographics
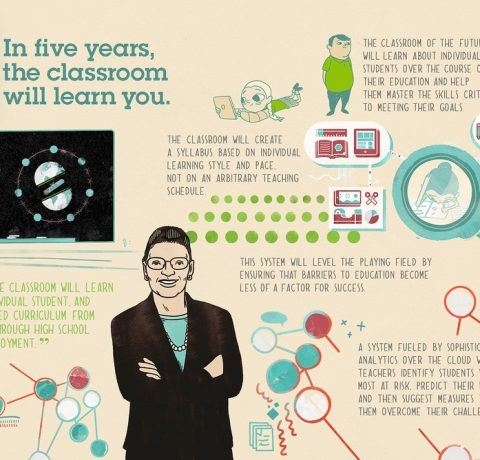
How Will Be in 5 Years Your Classroom Infographic
Teacher Infographics
How Will Be in 5 Years Your Classroom Infographic
Posted on January 9, 2014
The ability to deliver “affordable education at scale” is a key driver across the world. Though it is a huge issue and still early, thanks to the increased use of technology in teaching and learning, we are beginning to see the digital transformation of the education industry. The growth of Massive Open Online Courses (MOOCs) […]
 Other Infographics
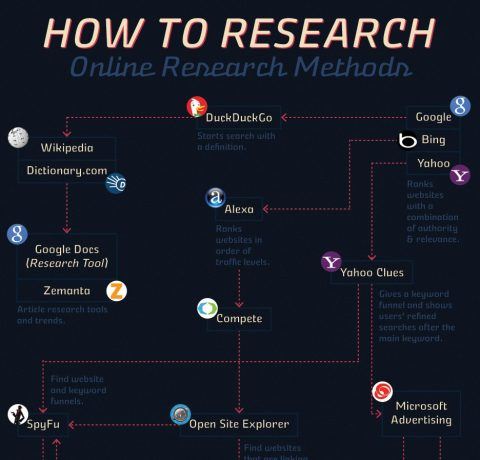
Online Research Methods Infographic
Other Infographics
Online Research Methods Infographic
Posted on January 7, 2014
Is it a social problem that people don’t know how to research?.Social networks have allowed the majority of us to believe information is readily available. The skill itself of “Research” has become diluted in it’s meaning. The Online Research Methods Infographic explores a range of web 2.0 research tools. This world of online data is […]
 Educational Technology Infographics
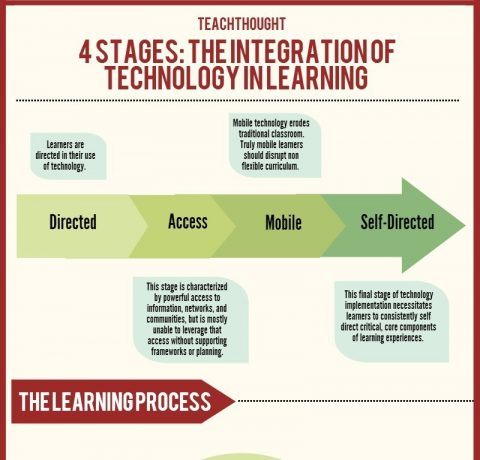
Stages of Educational Technology Integration Infographic
Educational Technology Infographics
Stages of Educational Technology Integration Infographic
Posted on January 6, 2014
Technology can be used in the learning process in a variety of ways. Some are supplementary, serving the original design of the classroom and usually automate some previously by-human task or process–grading multiple choice assessments, searching for a source of information, or sharing messages and other data across large groups. However fully integrated and embedded […]
 K12 Infographics
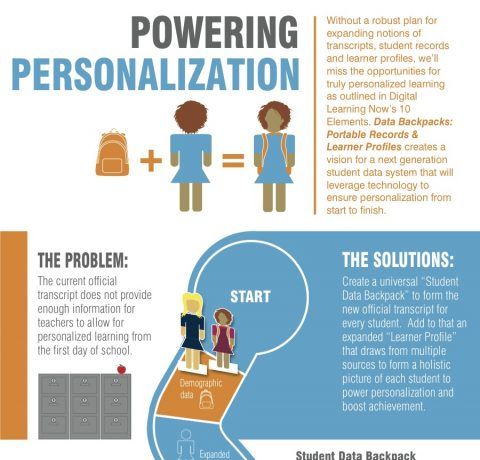
Powering Personalized Learning Infographic
K12 Infographics
Powering Personalized Learning Infographic
Posted on January 6, 2014
The current way student records and transcripts are managed is insufficient to meet the evolving needs of teachers, students, and parents. Without a robust plan for expanding notions of transcripts, student records and learner profiles, we’ll miss the opportunities for truly personalized learning. The Powering Personalized Learning Infographic presents “data backpacks” as the solution to […]
 Teacher Infographics
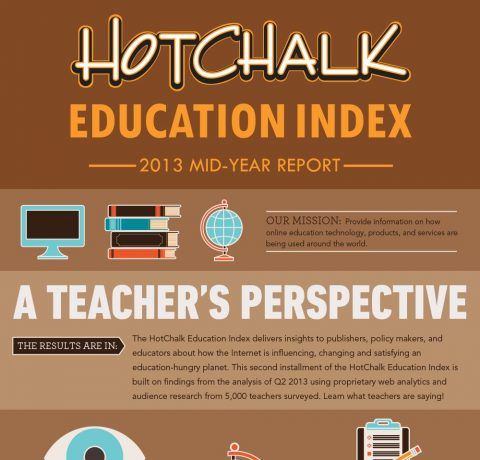
Education Index Infographic: Online Education vs. Traditional Education
Teacher Infographics
Education Index Infographic: Online Education vs. Traditional Education
Posted on January 5, 2014
The HotChalk Education Index (HEI) provides quarterly insights regarding how the Internet is impacting education. The HotChalk Education Index Infographic is a visual presentation of the first HEI report, which compiled survey data collected from over 25,000 students, teachers, parents, and administrators and found that students want to spend less time in classrooms and more […]
 Instructional Design Infographics
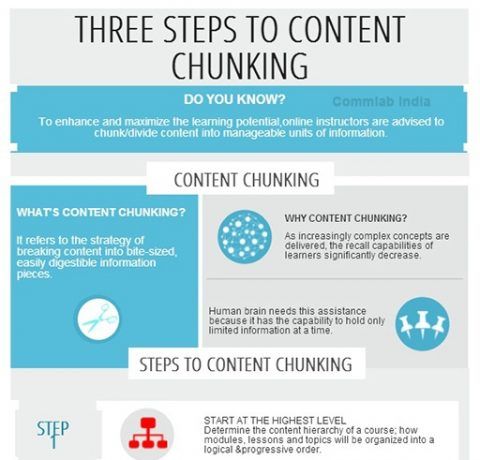
How to Chunk Content for eLearning Infographic
Instructional Design Infographics
How to Chunk Content for eLearning Infographic
Posted on December 29, 2013
One of the main concepts that leads to successful e-Learning course design is information chunking. But what is chunking? Why is it embedded in the world of instructional design? And what kind of chunking strategies can an instructional designer use to enhance learning? Chunking refers to the strategy of making a more efficient use of […]
 K12 Infographics
Parent Volunteers in the Classroom Infographic
K12 Infographics
Parent Volunteers in the Classroom Infographic
Posted on December 28, 2013
A recent survey of more than 1,000 parents and educators indicates that there is strong support for parent volunteers in the classroom, critical gaps between teacher needs and how parents are currently pitching in, and a wish from both groups to see the current parent volunteer roles grow. This survey opens a window into how […]
 Kindergarten Infographics
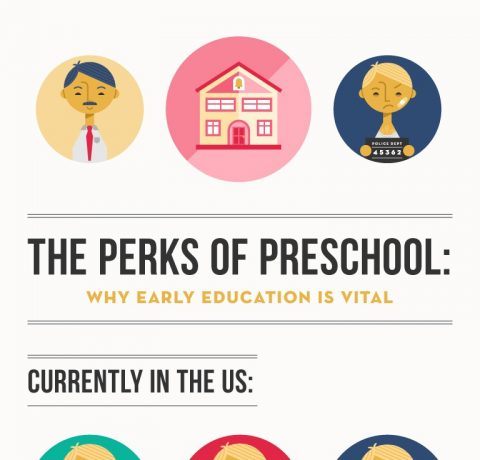
Why Early Education Is Vital Infographic
Kindergarten Infographics
Why Early Education Is Vital Infographic
Posted on December 26, 2013
Everyone has their own view on when a child should start school; while many kids begin to go to preschool as early as age three, some places in the world delay schooling until kids are six or seven. In studies of the US educational system, however, data points overwhelmingly toward the notion that when it […]
 Other Infographics
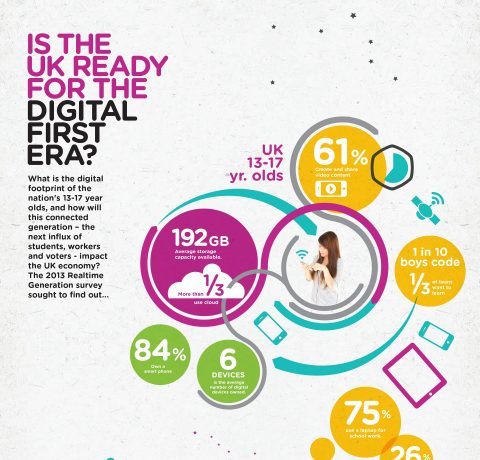
The Realtime Generation Infographic - Are you ready for the digital first era?
Other Infographics
The Realtime Generation Infographic - Are you ready for the digital first era?
Posted on December 11, 2013
Nationwide survey of 13-17 year olds reveals economic opportunity from generation’s IT aspirations and expectations. Slough, UK, 9 December 2013: A survey of more than 1000 UK 13-17 year olds points to a future workforce that is ‘digital first’ in everything it does, and whose digital talents could bring significant economic value to the UK. […]
 Higher Education Infographics
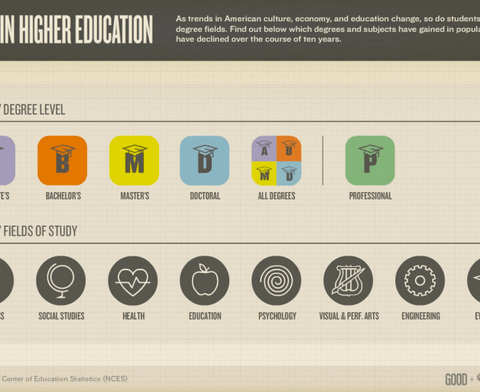
Trends In Higher Education Interactive Infographic
Higher Education Infographics
Trends In Higher Education Interactive Infographic
Posted on November 25, 2013
The Trends In Higher Education Interactive Infographic takes a look at how cultural and economic trends have changed American students' choices in degree fields between 1998 and 2008. The piece allows readers to look at the data through the lens of degree fields (Business, Education, Health, etc.) as well as through the lens of degree […]
 Elementary School Infographics
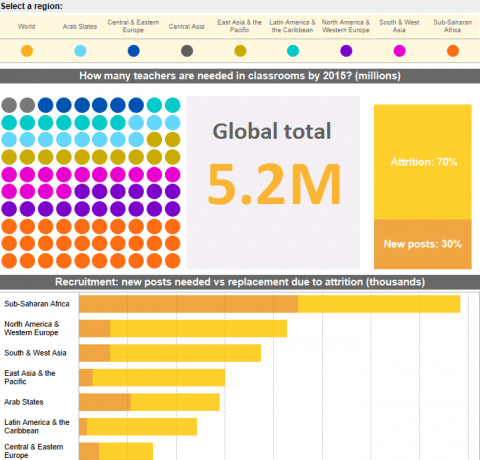
Every Child Needs A Teacher Infographic
Elementary School Infographics
Every Child Needs A Teacher Infographic
Posted on November 18, 2013
The supply of teachers is failing to keep pace with the demand for primary education. According to the latest UIS data, the world needs to create 1.6 million new teaching posts by 2015 in order to reach universal primary education, while replacing 5.2 million teachers leaving the profession. The situation is most extreme in sub-Saharan […]