Instructional Design Infographics
Top Instructional Designer's Skills Infographic
Posted on January 3, 2015
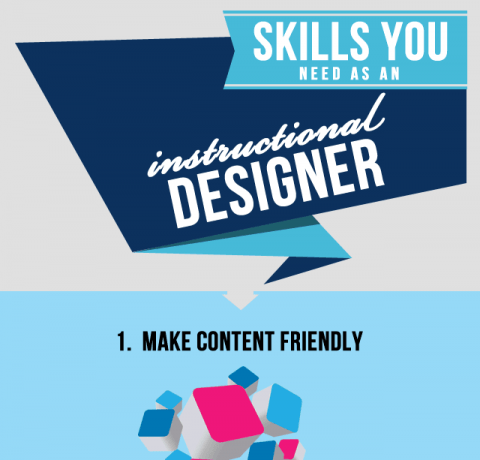
Top Instructional Designer's Skills Infographic A skillful Instructional Designer brings both technology and learning combined together not only in a digestible format but also at an appetising pace. An Instructional Designer breaks down content that involves any learning material, into something that is easy to comprehend; he or she also creates the content to be appealing […]
 Other Infographics
How to Improve L&D Performance in 2015 Infographic
Other Infographics
How to Improve L&D Performance in 2015 Infographic
Posted on January 2, 2015
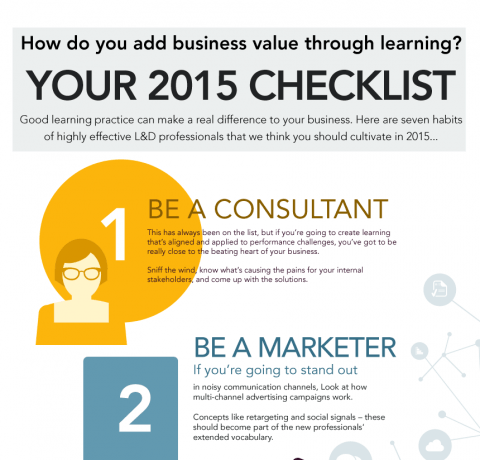
How to Improve L&D Performance in 2015 Infographic How do you add business value through learning? What makes an L&D professional effective? Each year, Kineo surveys leaders in L&D for their Learning Insights Report. This year's report highlights the importance of applied learning in helping businesses add value through learning, along with emerging trends and […]
 Higher Education Infographics
How Technology Can Improve College Student Success Infographic
Higher Education Infographics
How Technology Can Improve College Student Success Infographic
Posted on December 27, 2014
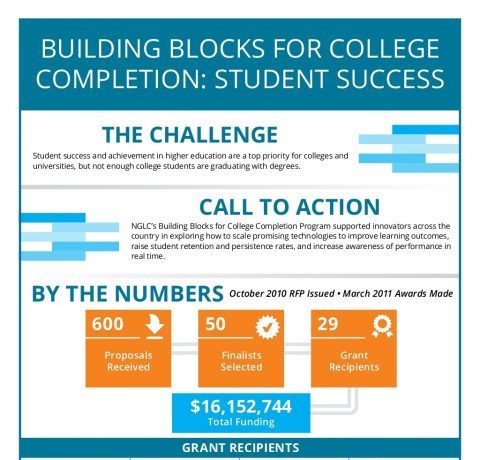
How Technology Can Improve College Student Success Infographic The success of college students is getting more attention these days with rising expectations, greater accountability (yet shrinking budgets), and dismal statistics.The reality we face in higher education today invites different approaches to promote student success. The How Technology Can Improve College Student Success identifies several ways […]
 Other Infographics
Santa’s Self-Help Guide to Creating Your CV Infographic
Other Infographics
Santa’s Self-Help Guide to Creating Your CV Infographic
Posted on December 26, 2014
Santa’s Self-Help Guide to Creating Your CV Infographic Some jobs are big. Huge. When you have a C-Level leadership role with global responsibility, how do you even begin to sum up what it is that you do? The Santa’s Self-Help Guide to Creating Your CV Infographic presents what Santa would write on his CV and […]
 eLearning Infographics
The Science of Attention in eLearning Infographic
eLearning Infographics
The Science of Attention in eLearning Infographic
Posted on December 21, 2014
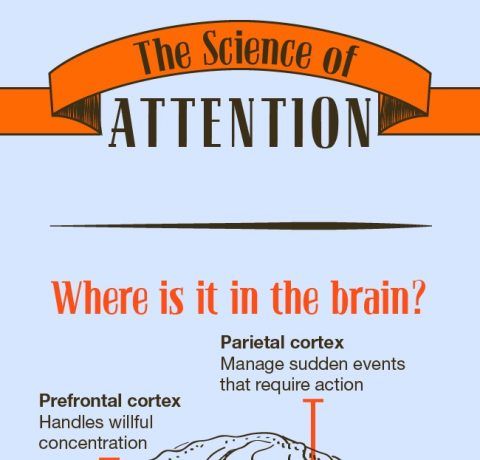
The Science of Attention in eLearning Infographic Attention refers to the capability of the brain to choose one aspect on which to concentrate while ignoring everything else in the environment. Helping students to pay attention is a primary concern of training. The Science of Attention in eLearning Infographic helps eLearning professionals understand how the attention […]
 MOOC Infographics
How Corporations Use MOOCs Infographic
MOOC Infographics
How Corporations Use MOOCs Infographic
Posted on December 20, 2014
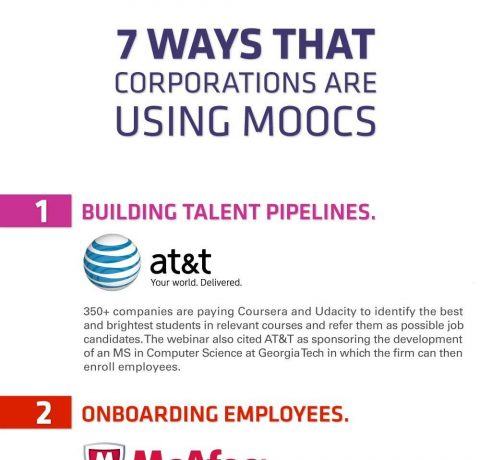
How Corporations Use MOOCs Infographic With rapid growth in the number of Massive Open Online Courses (MOOCs) and students, it was only a matter of time before corporate American sat up and took notice. The How Corporations Use MOOCs Infographic presents 7 ways corporations use MOOCs to meet some of the professional development and training […]
 Instructional Design Infographics
3 Levels of Instructional Design Prototypes Infographic
Instructional Design Infographics
3 Levels of Instructional Design Prototypes Infographic
Posted on December 16, 2014
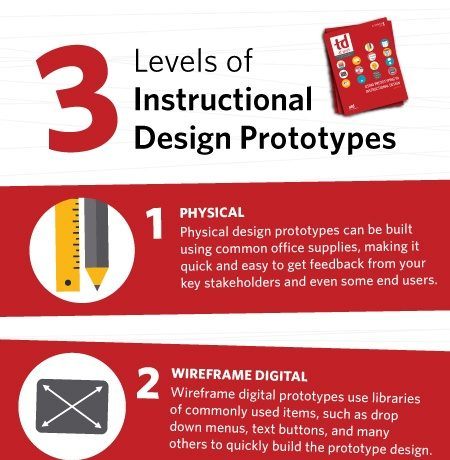
3 Levels of Instructional Design Prototypes Infographic Storyboarding and prototyping are key parts of the instructional design process that should not be skipped. Starting the overall design process with a storyboard provides a high-level outline of the intended outcomes of the module, and is an effective way to gather ideas in a graphical format before […]
 eLearning Infographics
How To Use e-Learning To Improve Employee Engagement Infographic
eLearning Infographics
How To Use e-Learning To Improve Employee Engagement Infographic
Posted on December 15, 2014
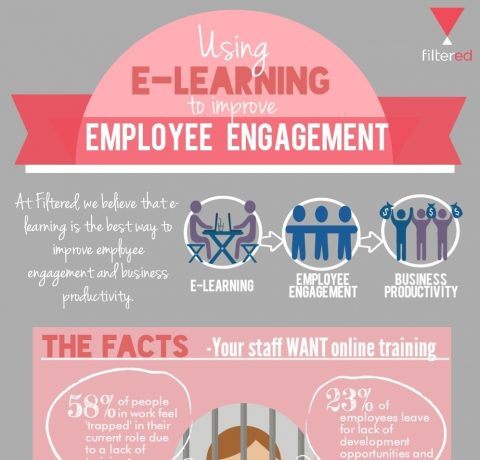
Using e-Learning To Improve Employee Engagement Filtered.com cannot stress the importance of using e-learning enough as a way to increase employee engagement in the work place. With a fast changing market, the key to staying in the game is to strategize in a way that maximizes both lifelong learning and business productivity. Train your staff to […]
 Mobile Learning Infographics
The Middle East Mobile Learning Infographic
Mobile Learning Infographics
The Middle East Mobile Learning Infographic
Posted on December 9, 2014
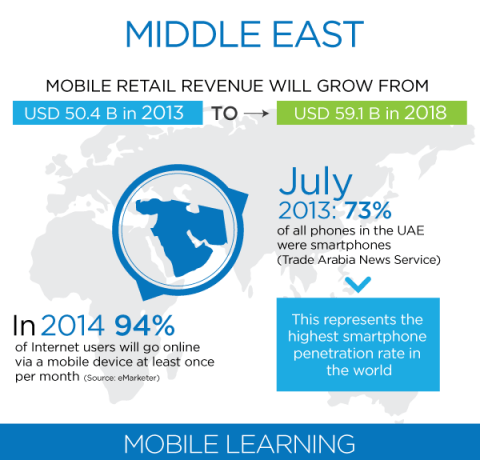
Mobile Learning in the Middle East Infographic For 30 years, from 1960 to 1990, the Middle East experienced a staggering growth rate due to the huge rise in the price of oil. The wealth derived from this unprecedented growth was channeled into improving the quality of life in the region, turning it into the must-go place […]
 eLearning Infographics
5 Things To Look Out For Choosing A Learning Management System Infographic
eLearning Infographics
5 Things To Look Out For Choosing A Learning Management System Infographic
Posted on December 4, 2014
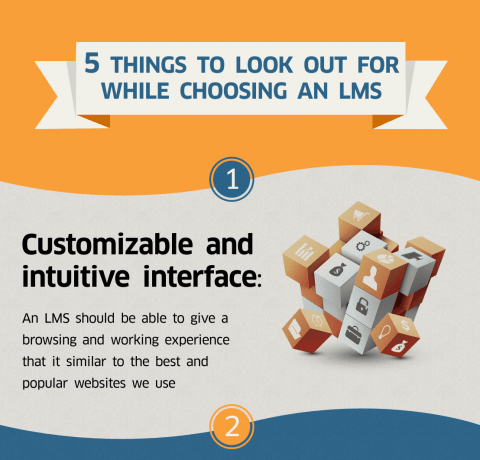
5 Things To Look Out For Choosing A Learning Management System Customizable and intuitive interface A good LMS is easily customizable. Customizability gives you that extra flexibility to add, delete or change whatever features you want. It should have a search feature- simple, yet extremely useful. Plus, if the interface is intuitive, for example if […]
 Instructional Design Infographics
5 Learning Principles L&D Professionals Need To Know Infographic
Instructional Design Infographics
5 Learning Principles L&D Professionals Need To Know Infographic
Posted on December 3, 2014
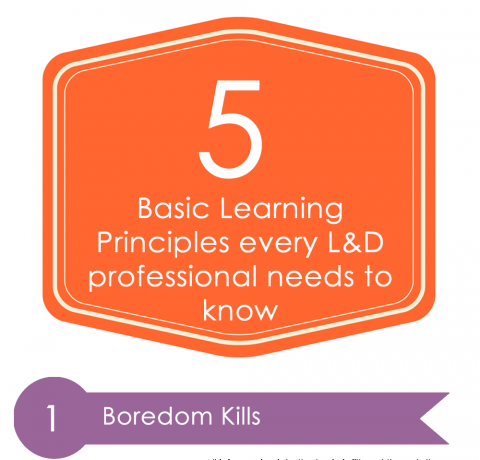
5 Learning Principles L&D Professionals Need To Know Infographic Learning and development professionals should ensure that everyone within their organisation knows and understands the information they require to function effectively and are able to apply it. With so much content available, they can easily get buried under a mountain of it before they even find what we are […]
 eLearning Infographics
Top 10 eLearning Trends For 2015 Infographic
eLearning Infographics
Top 10 eLearning Trends For 2015 Infographic
Posted on November 22, 2014
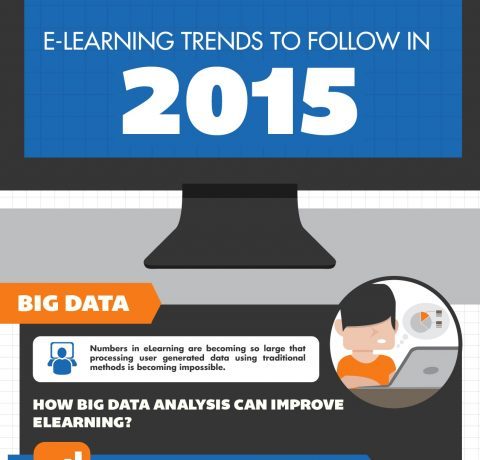
10 eLearning Trends to Follow in 2015 Infographic 10 eLearning Trends to Follow in 2015 Infographic shows elearning professionals what to follow in the coming year. 1. Big Data Numbers in eLearning are becoming so large that processing user generated data using traditional methods is becoming impossible. How big data analysis can improve e-learning? By […]