Search Results
How To Make Studying Count Infographic

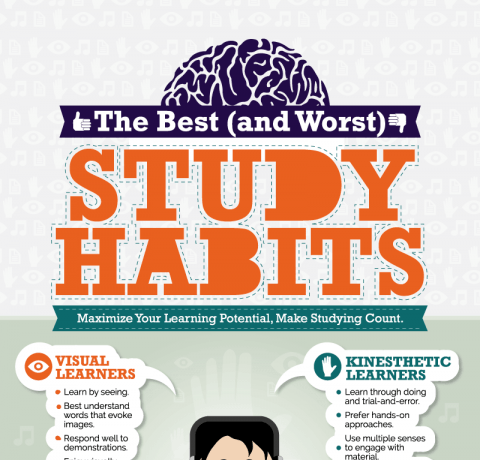
All methods for studying are not created equal. In addition to some being more efficient than others, study methods are highly personal and what works for one college student may not work for another. The How To Make Studying Count Infographic helps you understand your individual learning style and maximize your academic efforts. Remember: it’s […]

The Myth of Learning Styles Infographic

Advocates of the learning style theory argue that instructors can achieve much better results when they take their student’s learning style under consideration and create a course that best fits this exact style. The adversaries of the learning style theory say that this concept is misunderstood and not scientifically proven, and they argue that learning […]

What is Virtual Classroom? Infographic

Through superior flexibility and excellent quality, the concept of Virtual Classroom is quite old. It’s become an indispensable learning platform for millions of users and dedicated teachers across the world. If you’re taking an online class there’s a chance you’re running into this new method of education that can make you look, smart and updated. But […]

Middle East E-Learning Market Infographic

The Middle East E-Learning market is rapidly growing due to market makers such as Government, Private Schools and Corporates. This infographics is about 2013 E-Learning revenues, the market annual growth rate as well as the forecasts about 2016 revenues.

How To Use Pinterest With Bloom's Taxonomy Infographic

Would you like to know How to use Pinterest in the Classroom in a meaningful and relevant way? At the How To Use Pinterest With Bloom's Taxonomy Infographic you will find 25 ways to integrate Bloom's Taxonomy with Pinterest. By incorporating Pinterest into your lesson plans and overall classroom culture you will give you and your students […]

The 70-20-10 Model Infographic

Would you like to prepare your organization for the 70-20-10 Model? If yes I highly encourage you to read  The 70:20:10 L&D Model for Developing a High-Performing Workforce article There are two 70:20:10 models in business: 70:20:10 Model in Learning & Development 70:20:10 Model in Managing Innovation 70:20:10 Model in Learning & Development The 70:20:10 […]

Central and Eastern Europe Parenthood Infographic

The Parenthood Infographic shows the conditions and benefits of maternity & parental leaves in different countries of Central and Eastern Europe (Bulgaria, Romania, Slovenia, Slovakia, Czech Republic, Serbia, Poland, Croatia, Hungary and Ukraine). Infographics is based on Accace´s regionalu study "Parenthood in CEE".

The Power of the Educational Infographic

The educational infographics have become a staple for new and seasoned educators. The infographics are not just a place to share ideas, but are a place to bring educators together. When educators create infographics it encourages connected learning around the world. This infographic is from a presentation on what a few infographics have done to […]

Districts Learning Online Infographic

Within the 2013 California eLearning Census are five infographics which detail elearning's growth within K12 schools. This graphic shows the percentage of school districts that are utilizing online or blended learning and how eLearning varies between elementary and high school districts.

Background image Background image
Stay up to date on the latest eLearning news, articles, and free resources sent straight to your inbox!
Free Subscription