Districts Learning Online Infographic

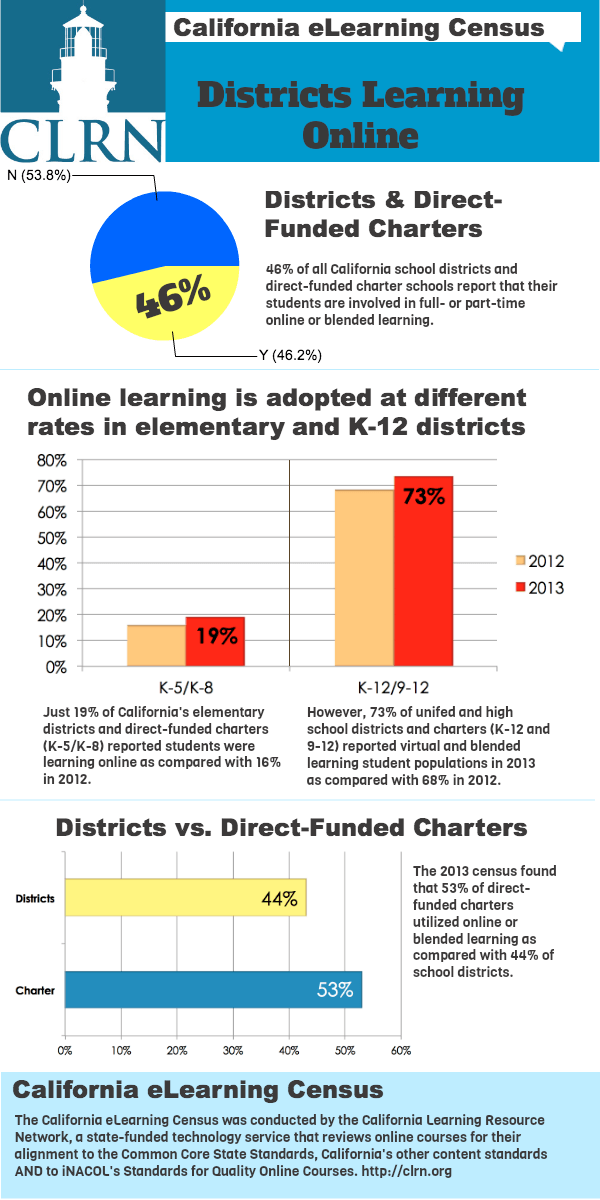
Within the 2013 California eLearning Census are five infographics which detail elearning's growth within K12 schools. This graphic shows the percentage of school districts that are utilizing online or blended learning and how eLearning varies between elementary and high school districts.

Via: http://bbridges51.edublogs.org/2013/05/20/elearning-census-infographic-districts-learning-online/
Copy code The code has been copied to clipboard!
Cookies disabled image In order write a comment you need to have functionality cookies enabled.
You can adjust your cookie preferences here.
Background image Background image
Stay up to date on the latest eLearning news, articles, and free resources sent straight to your inbox!
Free Subscription