Search Results
How Educational Technology is Being Used in the Classroom Infographic

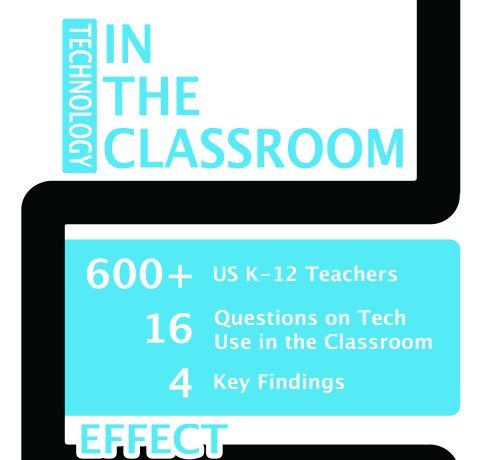
How Educational Technology is Being Used in the Classroom Infographic Digedu surveyed over 600 K-12 teachers across the United States trying to understand how teachers use technology in their classrooms in hopes of identifying best practices and contributing to the community’s continued development. Teachers report widely varying experiences when using technology. Nearly all said that […]

The Promise of Learning Analytics Infographic

The Promise of Learning Analytics Infographic At The Promise of Learning Analytics Infographic you will review the road to more differentiated and personalized education. The Road To More Differentiated and Personalize Education Traditional Education In traditional education a class with student is on the way to finish line at about the same pace and using […]

6 Amazing Statistics on Learning Management Systems Infographic

6 Amazing Statistics on Learning Management Systems Infographic The 6 Amazing Statistics on Learning Management Systems Infographic provides interesting LMS facts and stats: Moodle is the most popular learning management system in the world, according to a report from Capterra. Of the 78% of organizations who reported using a Learning Management System, 33% were looking […]

What People Love and Hate about eLearning Infographic

What People Love and Hate about eLearning Infographic The What People Love and Hate About eLearning infographic accompanies a new survey by Articulate that offers a deeper view into what people love and hate about online learning. Showcased through an exciting new infographic, the results highlight the survey of over 500 online learners. The survey and […]

Google Glass Educational Uses Infographic

Google Glass Educational Uses Infographic The Google Glass Educational Uses Infographic shows how Wearable Educational Technology like Google Glass can play a role in connected education. Connected education comes in many forms and goes beyond classrooms and to those of us long-since finished school. Here are a few possible uses of Google Glass. Can be used […]

Top Advantages of Asynchronous eLearning Infographic

Top Advantages of Asynchronous eLearning Infographic The Top Advantages of Asynchronous eLearning Infographic outlines the top benefits of asynchronous eLearning. Asynchronous eLearning Advantages Greater Accessibility Save Time and Boost Productivity Minimize Disruption to Workflow Scalability Eliminate Travel Costs Simplified Training Documentation Personalization Consistency Free Up Instructor Time

Top 10 eLearning Design Mistakes Infographic

Top 10 eLearning Design Mistakes Infographic The Top 10 eLearning Design Mistakes Infographic shows how you can create excellent eLearning courses that provide maximum eLearning ROI on your training expenditure by avoiding 10 eLearning design mistakes. These eLearning design mistakes are: No clear idea about the target audience Cluttered text Unclear navigation No realistic scenarios Ineffective […]

eLearning Dramatically Increases Retention Rates Infographic

eLearning dramatically increases the rate at which learners retain information. Why? Because learners have more control over their own learning process and the ability to retake training as needed. The Research Institute of America found that 33 minutes after leaving a lecture, only 58% of the material covered is retained. Seven days later, that drops […]

The High Value of Online College Education Infographic

With improved training costs, ongoing access to resources and better retention strategies, online education is causing world-famous universities to transform century-old models of learning and adapt their offerings to students' current needs. A survey of 1,500 past, present and future students conducted in 2013 reveals that online education is gaining revolutionary momentum. The The High Value […]

Employee Turnover Infographic

Employee turnover is enormously expensive. Studies from Bersin and the Bureau of National Affairs have recently demonstrated that the value of keeping employees can be many times greater than the cost of losing them. When an employee leaves, financial losses to the organization are both hidden and real. These include recruitment and onboarding costs, lost […]

eLearning Infographics Pros and Cons

Check the eLearning Infographics Pros and Cons before you start developing an eLearning Infographic. I highly encourage you to read the article Pros and Cons of eLearning Infographics. Last but not least, check the List of Free Tools to Create Infographics for your Learners.

Background image Background image
Stay up to date on the latest eLearning news, articles, and free resources sent straight to your inbox!
Free Subscription