
The Science Of Sharing: Who Shares What, Where, & Why Infographic
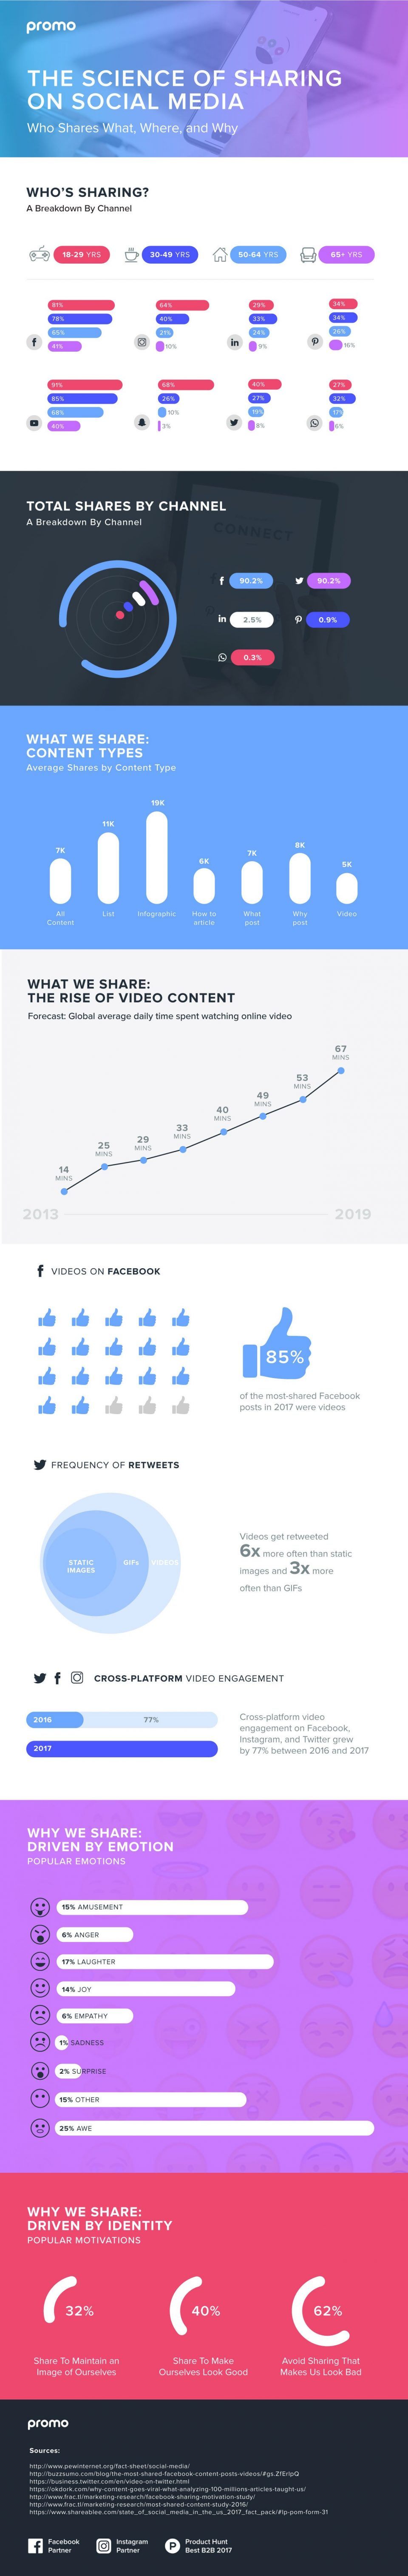
We wanted to better understand the behavior of people on social media—what age groups are sharing on what platforms, what content formats are shared, and what emotions inform our motivations.
We collected and compiled data to answer these questions. Here are some of our key takeaways:
- Approximately 90% of all sharing takes place on Facebook, with the Twitter following at 6% and Linkedin at 2.5%
- Infographics and listicles are out-shared above all other content formats, though the video is on the rise.
- Videos on Twitter are receiving 6x more RT than graphics, and 3x more than GIFs.
- More than 1/3 of people claim their social behaviors stem from the need to create a positive persona for themselves online.


You can adjust your cookie preferences here.