
![Measuring And Making The Most Of Metrics [Infographic]](https://cdn-infographic.pressidium.com/wp-content/uploads/SDI-Report-Infographic-Measuring-and-Making-the-Most-of-Metrics-1-e1544523073923-960x7299.jpg)
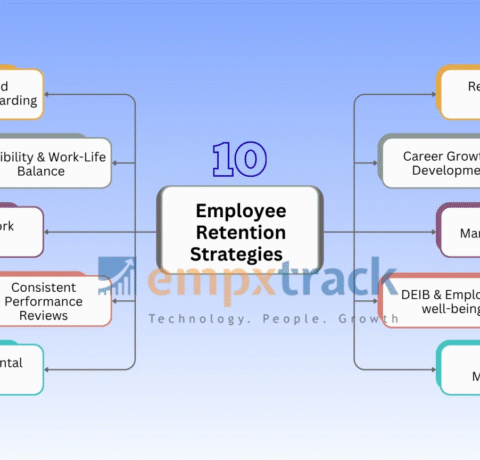
Measuring And Making The Most Of Metrics [Infographic]
There is a common misconception to measure almost everything within a service desk. There is no one-size-fits-all approach for every business. This infographic will explore what organizations are actually reporting on and how often, how they produce reports, and what they do with this data. This will enable us to understand whether the organizations could be reporting more efficiently and focus on how to gain the most value from metrics.
Are you drowning in spreadsheets, charts, and graphs and not able to really make sense of the output? So many numbers and so few answers.
There’s no doubt that service desk admins and managers are constantly bogged with “What are the metrics that should be measured?” or “What are the numbers that should be reported on?” questions.
No need to fret — SDI and Freshservice have done a joint research to give you a quick sanity check on the metrics that matter.


You can adjust your cookie preferences here.