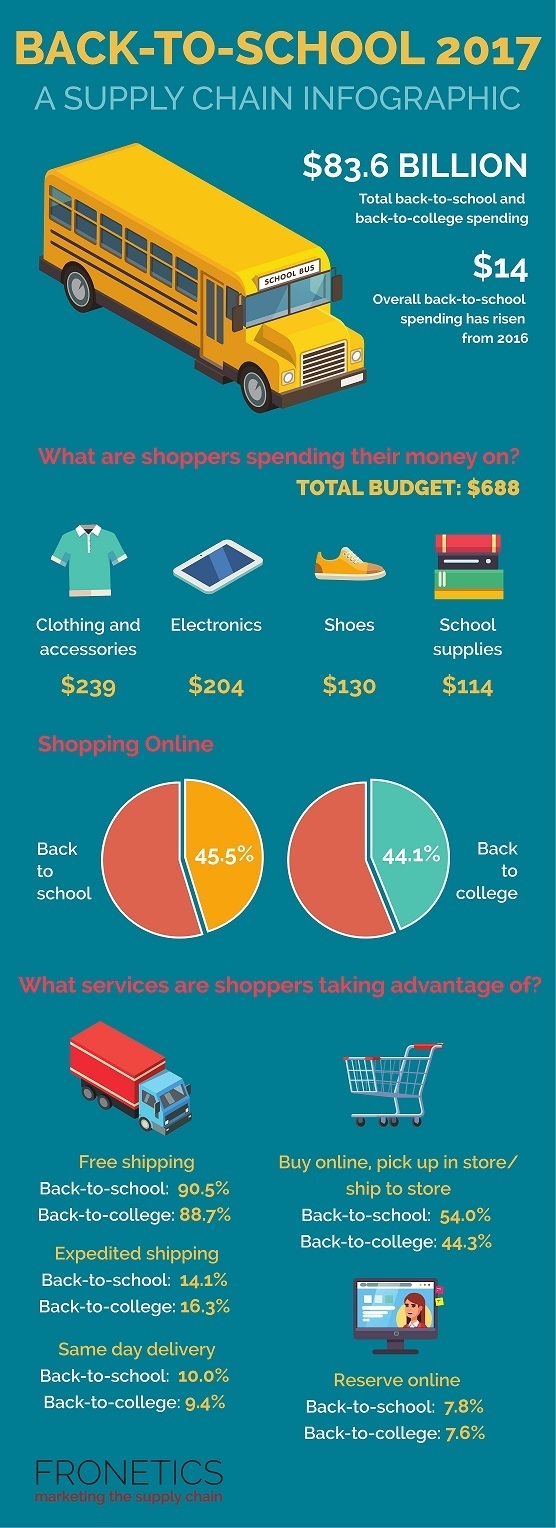
Back to School 2017 Supply Chain Infographic
With consumer confidence on the rise, the National Retail Federation predicts that back-to-college and back-to-school spending will hit $83.6 billion in 2017. That whopping total is an all-time high for back-to-college dollars, and the second highest on record for back-to-school spending, and represents and increase of more than 10% from last year.
If you started your shopping three weeks to one month before school starts, you likely found the longest lines: 46.7% of shoppers report that that’s when they planned to hit the shelves for back-to-school shopping, and 34.6% for back-to-college.
The top destinations for back-to-school shoppers are department stores (57.1%), discount stores (54.1%), and clothing stores (46.0%), while back-to-college shoppers prefer online shopping (44.1%), with discount stores (40%) and department stores (38.5%) following in second and third place. A whopping 90.5% of back-to-school shoppers plan to take advantage of free shipping services, with 88.7% doing the same for back-to-college shipping.
Per household, overall back-to-school spending has risen from last year’s average of $674 to $688 in 2017. The NRF predicts that 64% of that total will be spent on apparel and electronics.
Check out the Back to School 2017 Supply Chain Infographic with some interesting facts from the NRF’s 2017 survey.
See also: Back to School Sales 2017: Trends and Statistics Infographic


You can adjust your cookie preferences here.