Infographics in eLearning Infographic
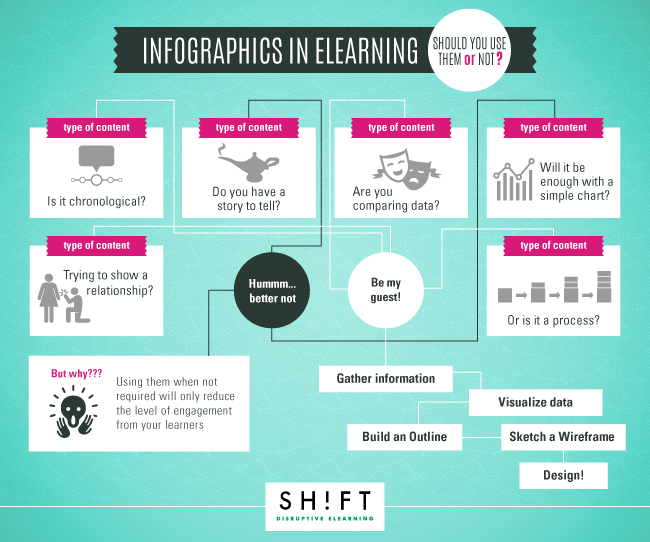
Do your learners prefer acquiring and processing information via images, pictures, maps, graphs, charts, illustrations, and other visual aids? Since they are visual learners have you thought of using infographics at your course? People have come to love Infographics since they are attractive and compelling! They simplify data and makes consuming them easier. They are exciting! And they jazz up your eLearning course like few other elements can! The Infographics in eLearning Infographic highlights the types of eLearning content for which an infographic is the best choice (and for which other forms of visual aid should be used).
When to Use Infographics in eLearning
- When there is a chronological story to tell: This can include a biography of a person, growth of a business, or an evolutionary history of process/product.
- When you’re contrasting data. Comparing two processes, ideas, items, or people? Infographics are the best way for summarizing the thoughts.
- When you are connecting concepts. When showing relationships between events, categories, ideas, and time.
- When you want to explain a process. Technical subject matter can easily be explained with symbols, icons, and shapes.
When not to Use Infographics in eLearning
Using infographic when not required will only reduce the level of engagement from your readers. Avoid using infographics when:
- When you have to tell a simple narrative. If simply have to tell a story, get on with it. If told correctly (a proper beginning, middle, and end) it will still be appreciated.
- When a simpler graphic will suffice. If your idea can be communicated using simple shapes and graphics, avoid an infographic.
- Because you think it would be cool. Infographics costs time and money. You want to make the most cost-effective eLearning experience — one that leverages visuals to boost engagement and not to incur costs. It may be tempting, but stay put.
Read also: List of Free Tools to Create Infographics for your Learners


You can adjust your cookie preferences here.