Tips & Tools For Creating Infographics Infographic
These days infographics can be found on all kinds of sites, from news portals to simple blogs. Whether you are selling something, or just blogging about everyday stuff, having an infographic on your blog every now and then will only bring you benefits. Yes, it might take some time and certain skills to create an outstanding and useful infographic, but oh, it is worth it.
Why Do I Need Infographics On My Site?
Let’s start with the sheer definition of an infographic. According to Wikipedia, an infographic is a visual representation of information, data or knowledge, made with intention to present complicated information quickly and clearly. Infographic creators usually gather previously done researches or large sets of data and pull out the most important parts, create visual representations of statistic information and put it all together without too much text. This procedure makes sometimes complex and huge amount of information easier to understand and more appealing.
They give your website a visual boost
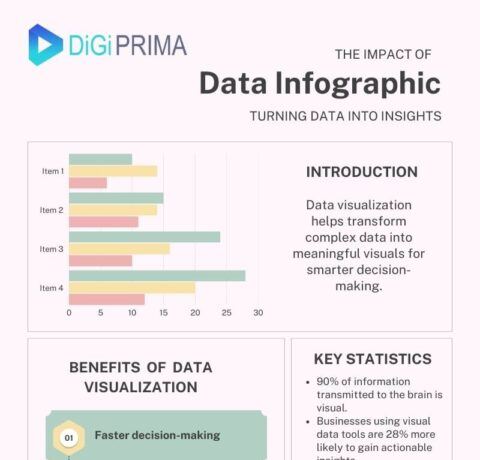
Of course, it doesn’t always have to be about an in-depth research or a lot of statistics and numbers. Infographics can be made for tutorials, product presentation, CV, or just a visual representation of text you wrote and think it could use a visual boost. 90% of information our brain receives is visual, and people are more likely to notice and remember an image than a bunch of text, no matter how interesting and well formatted it is. In modern, fast life, attention span of an average online reader is really short, so it’s a good idea to use infographics to grab their attention as fast as possible. If the graphic is designed well, with good quality images and nice colors, they will stick around, read it, read the blog post around it (if there’s any), and share it with their friends.
They are very shareable
This brings us to another big benefit of infographics – they are very shareable. I don’t know about you, but I see at least one infographic appear every day on all of my social feeds. They get shared because of good design, and well explained and useful information. A good and relevant infographic can easily start a conversation and engage your audience on another level besides “just” sharing and liking. All this can make an infographic go viral, which is the best thing that can happen to your site. Getting something to be viral isn’t easy and just designing a great infographic won’t be enough, but it’s a first step.
They will raise your brand awareness
When creating an infographic, whether you are doing it yourself or outsourcing it, make sure you include your brand name, website URL and a logo, if you have one. This will raise your brand awareness no matter how many shares and where it gets them. People will look for who made it and which site is it on, and think „Oh, look, this site is reliable, offers valuable information and makes it look nice as well!“. There’s a high probability they will look around your whole site, like or follow your social media profiles and use your product or service, if you are offering them. Your brand awareness will raise even more if you join in conversation that your infographic started.
They are great for SEO
All these benefits mentioned together create one more. Infographics are great for SEO and building your backlink profile. Each share and mention on social media gets you “points” in search rankings. If another site or blog picks up and shares your infographic in separate article, that’s even better linking opportunity. Since infographics are visual interpretations of information, you can recycle that information, write it down in text and create press releases or plain articles to share around specialized sites and get links from there as well. Not to mention how important brand awareness and social signals are for SEO in general, but that’s a whole other article!


You can adjust your cookie preferences here.