
15 eLearning Statistics You Need to Know for 2015 Infographic
It’s the beginning of a new year and 2015 looks set to be an exciting one for eLearning! The digital learning scene changes and expands so fast, it can be hard to keep up sometimes. The 15 eLearning Statistics You Need to Know For 2015 Infographic presents the fifteen eLearning statistics you need to be aware of for 2015.
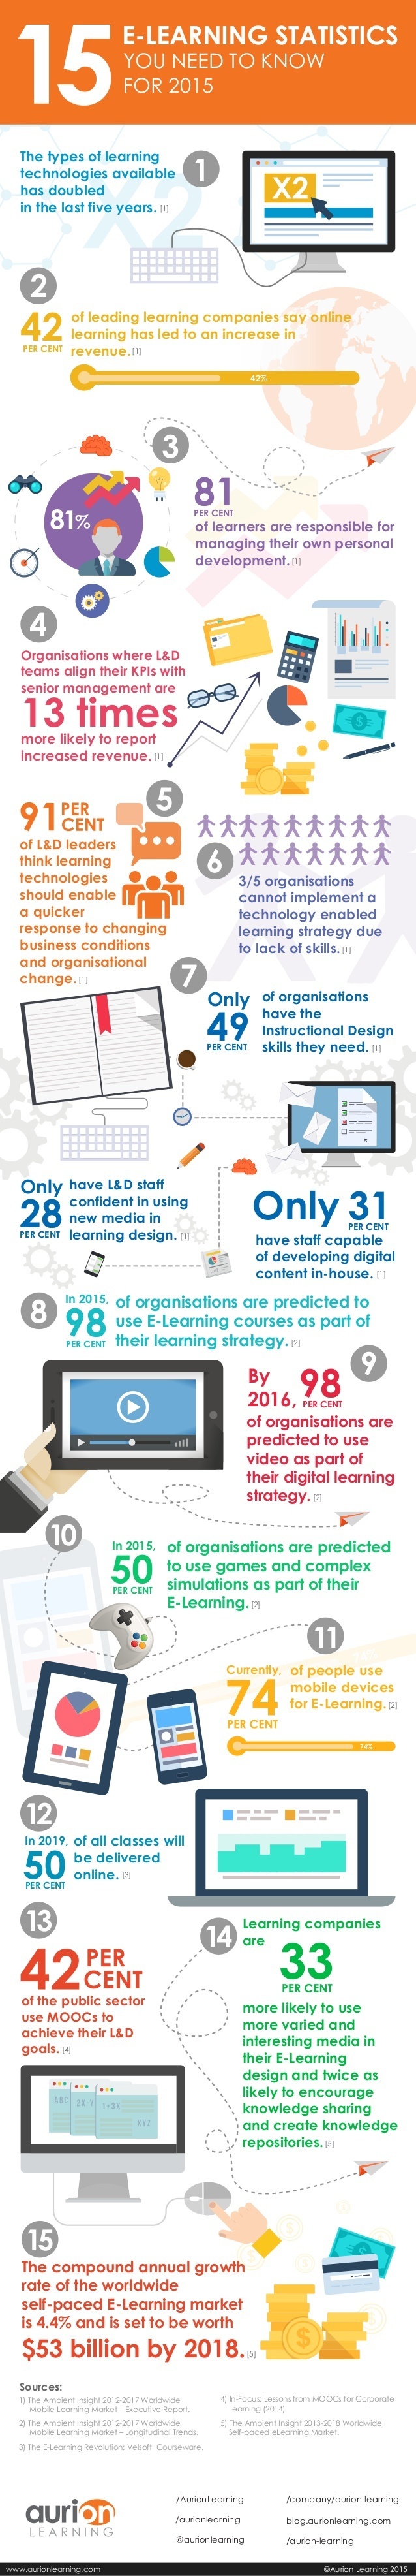
15 eLearning Statistics for 2015
- The number of types of learning technologies available has doubled in the last five years.
- 42% of leading learning companies say online learning has led to an increase in revenue and 56% say it has improved productivity.
- 81% of learners are responsible for managing their own personal development and 82% like to learn at their own pace.
- Organisations where L&D teams align their KPIs with senior management are 13 times more likely to report increased revenue and 50% more likely to see positive changes in staff behaviour.
- 91% of L&D leaders think learning technology should enable a quicker response to changing business conditions and organisational change.
- 3/5 organisations cannot implement a technology enabled learning strategy due to lack of skills.
- Only 49% of organisations have the Instructional Design skills they need. Only 28% have L&D staff confident in using new media in learning design. Only 31% have staff capable of developing digital content in-house.
- In 2015, 98% of organisations are predicted to use eLearning courses as part of their learning strategy.
- By 2016, 83% of organisations are predicted to use video as part of their digital learning.
- In 2015, 50% of organisations are predicted to use games and complex simulations as part of their eLearning.
- Currently, 74% of people use mobile devices for eLearning, this will rise to 81% by 2016.
- By 2019, 50% of all classes will be delivered online.
- 42% of the public sector use MOOCs to achieve L&D goals.
- Leading learning companies are 33% more likely to use more varied and interesting media in their eLearning design, twice as likely to encourage knowledge sharing and twice as likely to create knowledge repositories.
- The compound annual growth rate of the worldwide self-paced eLearning market is 4.4% and is set to be worth $53 billion by 2018.
View also: Top eLearning Stats and Facts For 2015 Infographic
Read also: The Top eLearning Statistics and Facts For 2015 You Need To Know


You can adjust your cookie preferences here.