

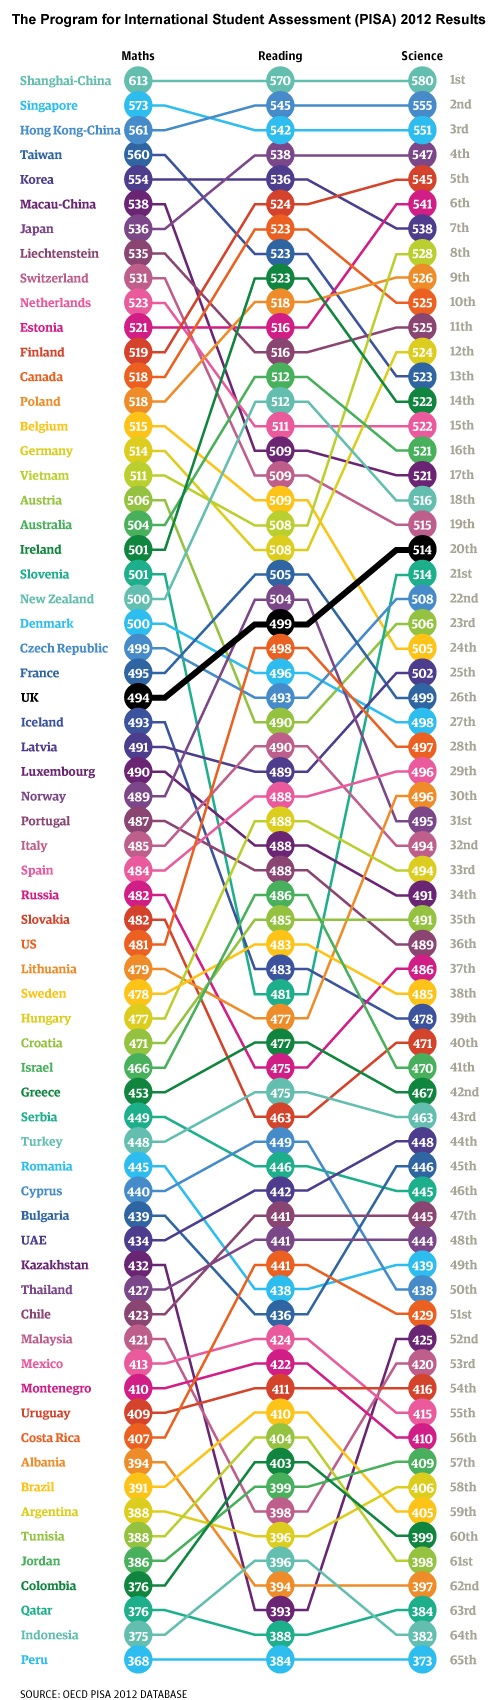
How OECD countries scored at the PISA's 2012 results? How does your country compare for reading, maths, and science?
More than 510,000 students took part in this latest PISA survey, representing about 28 million 15-year-olds globally.
These PISA results reveal what is possible in education by showing what students in the highest-performing and most rapidly improving education systems can do.
I highly encourage you to check the latest Programme for International Assessment (Pisa) results and you are more than welcome to let me know your thoughts!
This awesome infographic was created by Finbarr Sheehy


You can adjust your cookie preferences here.