Workflow Learning for Continuous Workplace Learning
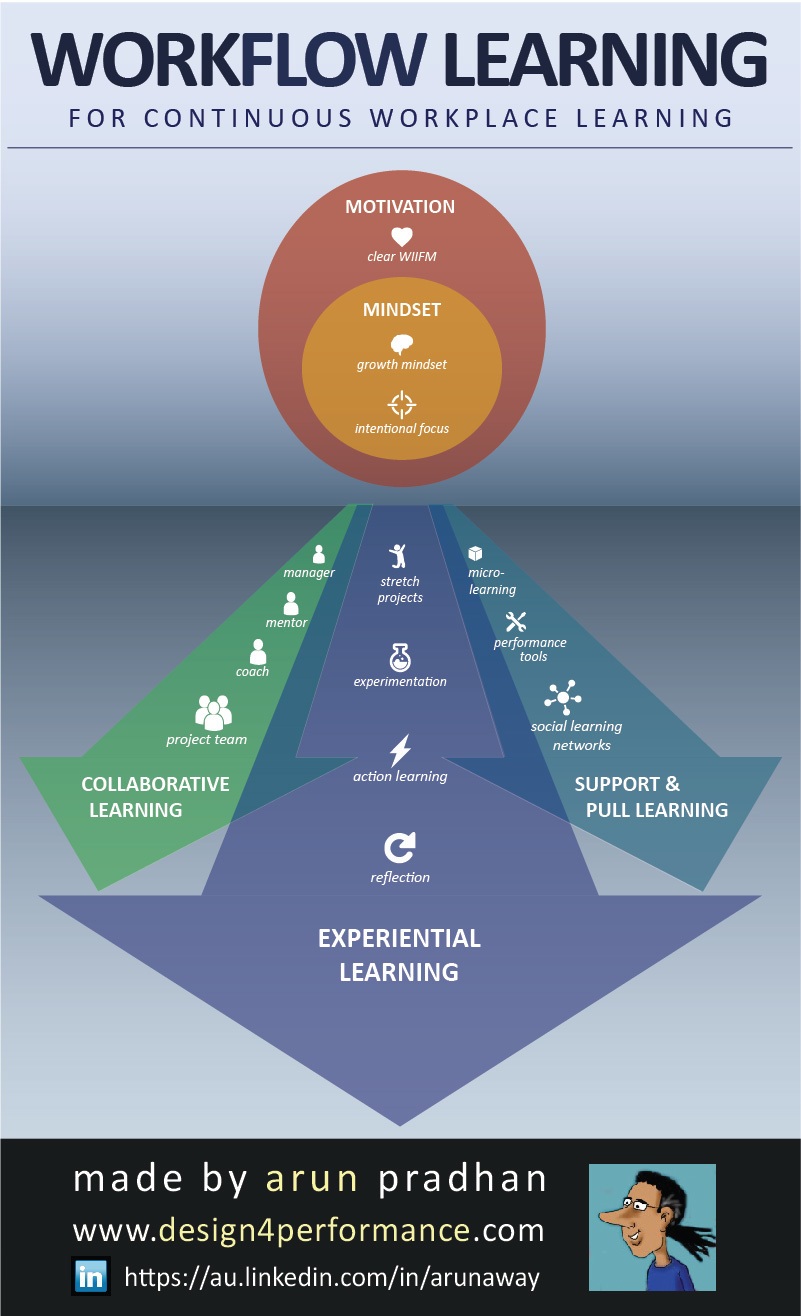
Charles Jennings recently challenged L&D to ‘start with the 70 and plan for the 100‘. The book "702010 towards 100% performance" provides the first comprehensive and practical guidance for supporting the 70:20:10 model. Many Learning & Development leaders are using the 70:20:10 model to help them re-position their focus for building and supporting performance across their organisations. They are finding it helps them extend the focus on learning out into the workflow. The Workflow Learning Infographic explores that approach by focusing on workflow learning, starting with what’s happening in the workplace and drawing on pull resources and collaboration to support deep and continuous learning.
The 70, 20 and 10 categories refer to different ways people learn and acquire the habits of high performance. ‘70’ activities are centred on experiential learning and learning through support in the workplace; ‘20’ solutions are centred on social learning and learning through others; and ‘10’ solutions are centred on structured or formal learning.
- 10 solutions include training and development courses and programmes, eLearning modules and reading.
- 20 solutions include sharing and collaboration, co-operation, feedback, coaching and mentoring.
- 70 solutions include near real-time support, information sources, challenges and situational learning.
Traditionally, L&D has been responsible for services in the ‘10’, and sometimes for more structured elements in the ‘20’ (such as coaching and mentoring programmes). The ‘10’ has primarily involved designing, developing and implementing structured training and development interventions. When done well, these ‘10’ interventions can successfully help to build performance. However, learning which occurs closer to the time and place where it is to be used has a greater chance of being turned into action and result in performance improvement. The closer learning is to work, usually the better. In other words, 10 solutions are likely to have less business impact and provide less value than the 70 and 20 solutions in the long run.


You can adjust your cookie preferences here.