Submit Education Infographics
Publish eLearning Article
List Top EdTech Blog
Submit Free Video Tutorial
Free eBooks
Advertise
Find Top LMS
EdTech
e-Learning
Blended Learning
Distance Education
Instructional Design
Mobile Learning
School
Preschool
Pre-kindergarten
Kindergarten
K12
Elementary School
Middle School
High School
Higher Education
Undergraduate School
Graduate School
Special Education
Adult Education
Continuing Education
Teacher
Student
MOOC
Gamification
Social Learning
Other
Submit infographic
Search for...
Home
/
/
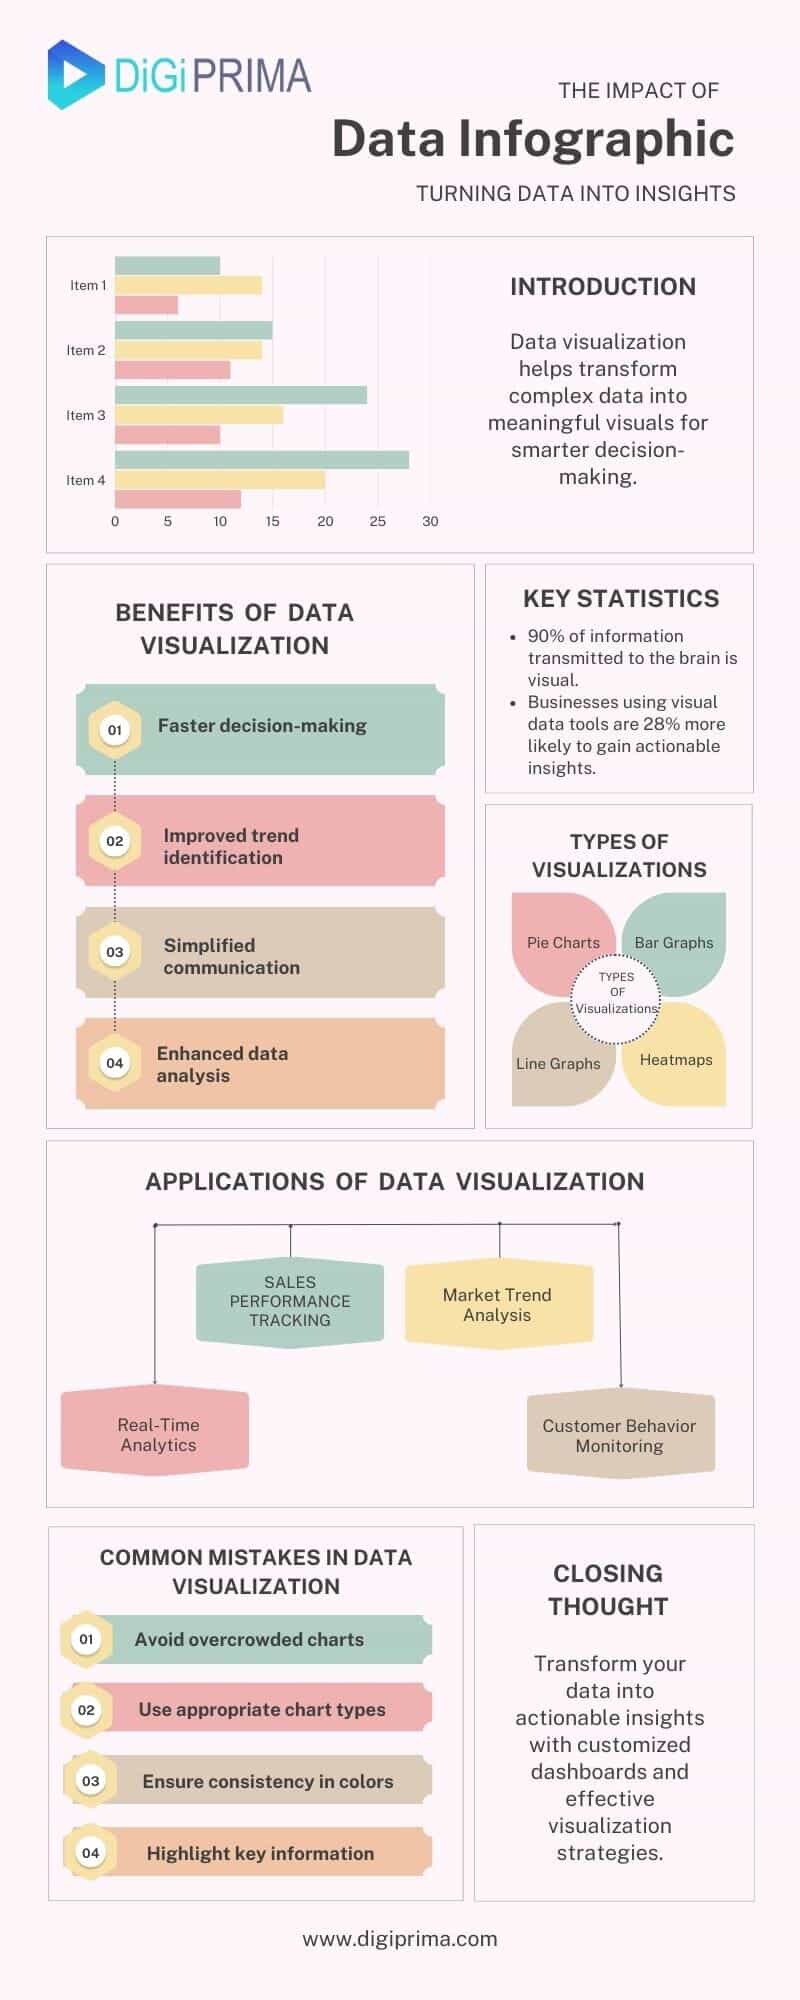
The Power Of Data Visualization
Posted on April 7, 2026
How To Make A Training Module
Posted on April 1, 2026
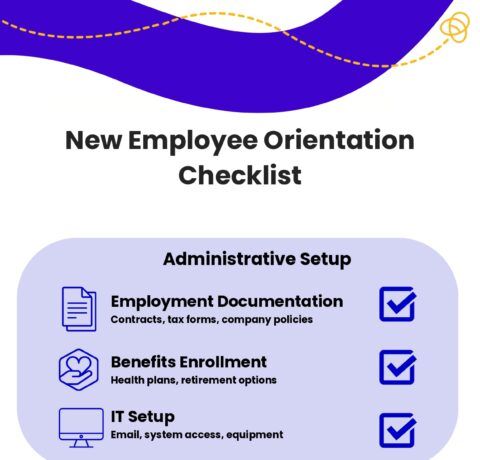
New Employee Orientation Checklist
Posted on March 26, 2026
No-Code Meets AI Unlocking Intelligent Automation for Everyone.
The Power Of Data Visualization
Posted on February 7, 2025
View full infographic
The Power Of Data Visualization
Via:
Embed this Infographic on your site or blog!
<a href="https://elearninginfographics.com/the-power-of-data-visualization-turning-complex-data-into-meaningful-insights/the-power-of-data-visualization/" title="The Power Of Data Visualization"><img src="" alt="The Power Of Data Visualization"></a>
Copy code
The code has been copied to clipboard!
In order write a comment you need to have functionality cookies enabled.
You can adjust your cookie preferences
here
.
Stay up to date on the latest eLearning news, articles, and free resources sent straight to your inbox!
Free Subscription


You can adjust your cookie preferences here.