
Rock Your Back-to-School Sales and Marketing Infographic
For many retailers, back to school season is a huge opportunity. However, back-to-school buying habits aren’t always the easiest to follow. This is why our folks at The Shelf tried to make this lesson a bit easier to understand with The Rock Your Back-to-School Sales and Marketing Infographic. It’s full of facts and figures to help you make the most of the retail shopping frenzy that defines this adrenalin-fueled rush to get the coolest gear in hopes of being “too cool for school”.
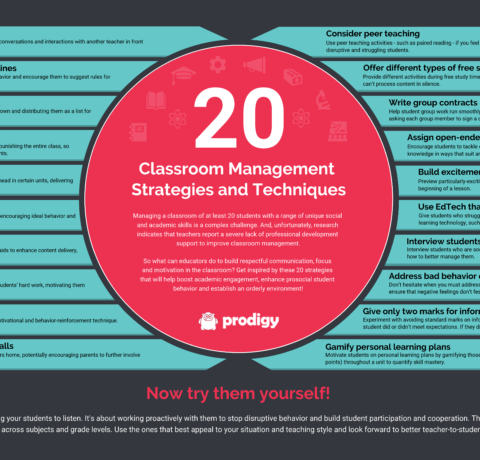
Timing
In all sales the right timing is everything. Timing makes Back-to-School marketing a little challenging. Indeed, there are no clear deadlines as to when this period starts or ends. Studies show that people shop from April to September, with peak times for different product types.
Products Sold, and Products Bought
The three types of products sold during this period are clothing, supplies, and snacks. Whilst it seems obvious that snacks will be bought towards the end of the holiday, clothing happen to be bought more or less all the time, and supplies really at the beginning of the school holiday.
Parents and schoolers buy according to three factors:
- what is useful
- their kid’s/own taste
- discounts
If the final choice remains in parents’ hands (for underaged kids), they are greatly influenced (59% admit it) by their children. Usefulness is a must, and brands are a detail. What really matters to kids is the appearance. Can they brag about it? If you are selling material for advanced high-schoolers or college students, then make sure the product is plain, and well-suited, practical. At some age, it is not about how cute a pair of scissors looks anymore, it is about the efficient ‘can it cut well, and fit in my pencil-case’ feature.
Discounts are the last factor entering customers’ mental algorithm. Sure, back-to-school holiday is a great opportunity (again, worth $828 billion this year) to make money.
Do Not Neglect the Digital World
We are living in weird times where people are as physically present than they are virtually. Indeed, you may witness rush in supermarkets, with parents and kids going from one end of the shop to another; yet, this doesn’t mean they are not also doing it at home. Online purchases represent 7.9% of the overall sales. It is not to be neglected.
Also, not only do parents, or students buy online, but they also check for discounts, and seek for online advice. The better feedback you have on your products, the more customers will be willing to buy it.
Many other tips are given throughout the infographic. Read through all these detailed data, and make some of your own business decisions according to it.
See also: 2016 Back-To-School Cheat Sheet for Marketers Infographic


You can adjust your cookie preferences here.