


Back to School Infographic by the Numbers
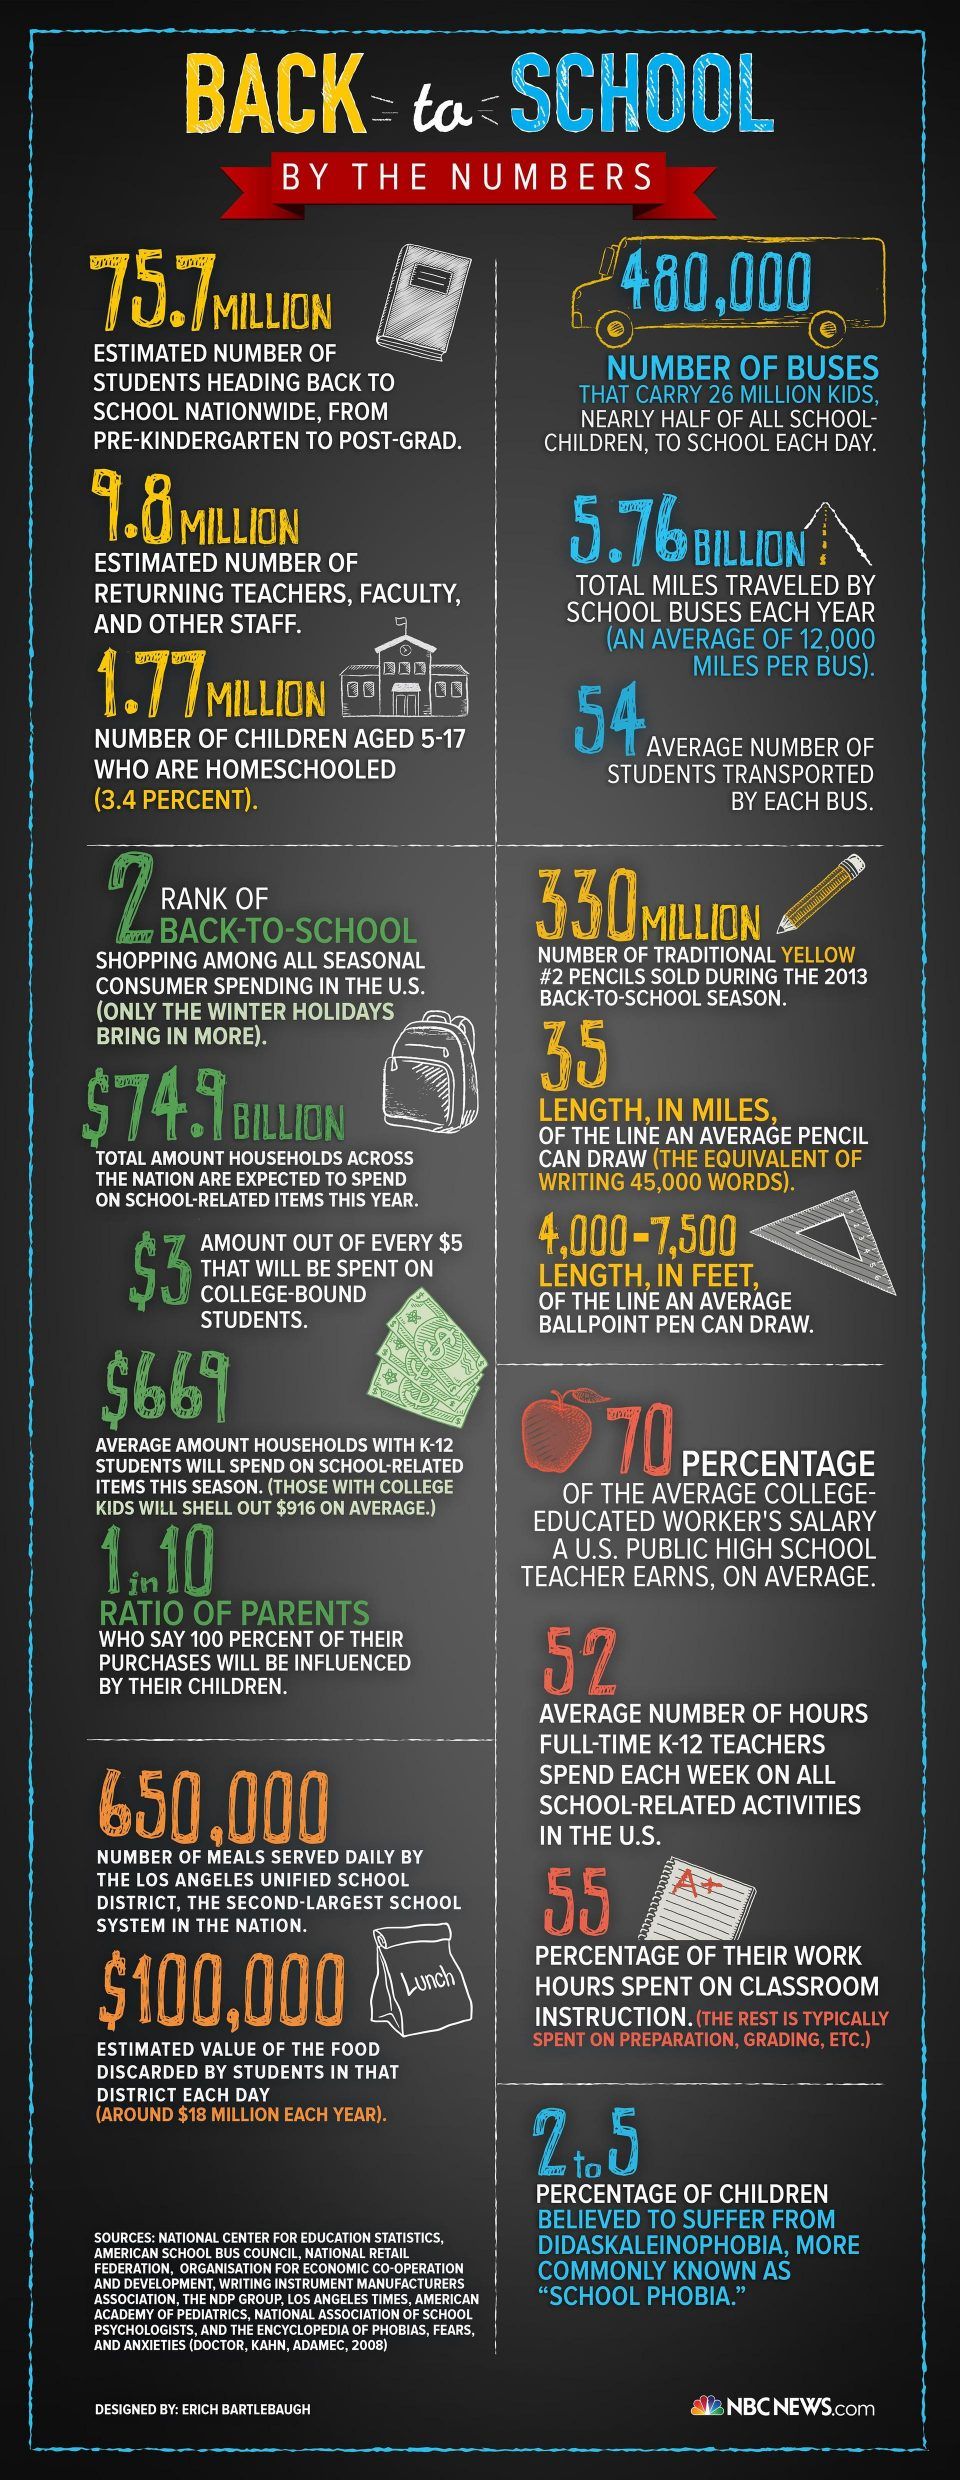
- 75.7 million: estimated number of students heading back to school nationwide, from pre-kindergarten to post-grad.
- 9.8 million: estimated number of returning teachers, faculty, and other staff.
- 1.77 million: number of children aged 5-17 who are homeschooled (3.4%)
- 480,000: number of buses that carry 26 million kids, nearly half of all school children, to school each day
- 5.76 billion: total miles traveled by school buses each year (an average of 1,200 miles per bus)
- 54: average number of students transported by each bus.
- 2: rank of back-to-school shopping among all seasonal consumer spending in the U.S. (Only the winter holidays bring in more).
- $74.9 billion: total amount households across the nation are expected to spend on school-related items this year.
- $3: amount out of every $5 that will be spent on college-bound
- $669: average amount of households with K-12 students wills spend on school-related items this season. (Those with college kids will shell out $916 in average)
- 1 in 10: ratio of parents who say 100% of their purchases will be influenced by their children
- 330 million: number of traditional yellow #2 pencils sold during 2013 back-to-school season
- 35 length in miles of the line an average pencil can draw (the equivalent of writing 45,000 words)
- 4,000-7,500 length, in feet, of the line an average ballpoint pen can draw
- 70% of the average college-educated worker’s salary a U.S. public high school teacher earns, on average.
- 52: average number of hours full-time K-12 teachers spend each week on all school-related activities in the U.S.
- 55 percentage of their work hours spent on classroom instruction (the rest is typicaly spent on preparation, grading, etc.)
- 650,000: number of meals served daily by the Los Angeles unified school district, the second largest school system in the nation
- $100,000: estimated value of the food discarded by students in that district each day (around $18 million each year)
- 2 to 5: percentage of children believed to suffer from didaskaleinophobia, more commonly as “school phobia”


You can adjust your cookie preferences here.