K12 Infographics
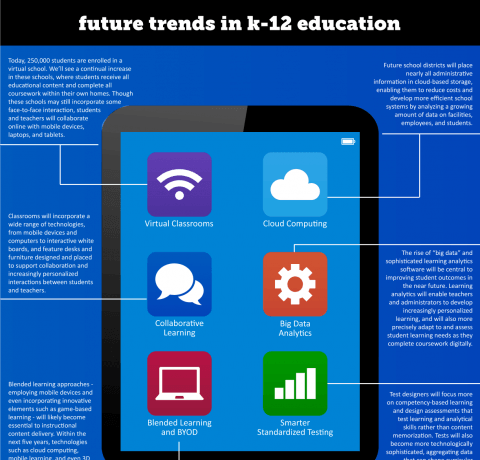
Future Trends In K-12 Education Infographic
Posted on February 8, 2014
The above findings are part of our December 2013 report "Future Trends In K-12 Education." For this report, Hanover turned to a wide range of literature sources to outline topics such as personalized learning practices and online and hybrid learning trends. Throughout the report, Hanover provides concrete examples of the future of K-12 education through […]
 Instructional Design Infographics
How to Stimulate Recall of Prior Learning Infographic
Instructional Design Infographics
How to Stimulate Recall of Prior Learning Infographic
Posted on February 3, 2014
Robert Gagné proposed a model of nine events which follow a systematic instructional design process. Each of the nine events of instruction is highlighted in a series of infographics. The How to Stimulate Recall of Prior Learning Infographic refers to Gagné’s 3rd event of instruction and presents ways teachers can determine students' prior knowledge.
 Educational Technology Infographics
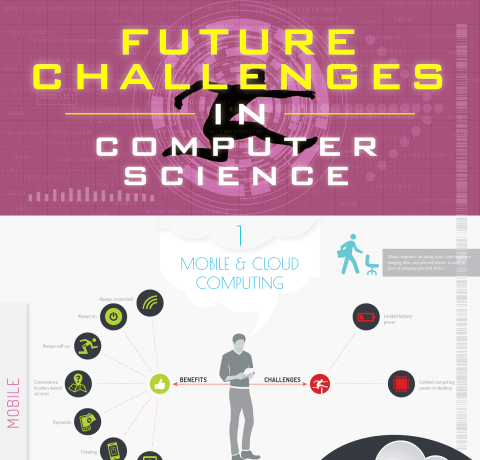
Future Challenges in Computer Science Infographic
Educational Technology Infographics
Future Challenges in Computer Science Infographic
Posted on February 2, 2014
Computer Science: Facing Challenges and Improving the World Computer science is faced with many challenges as the digital universe expands. From mobile and cloud computing to data security, addressing these issues can require large, structural changes, but an examination of these problems can lead to organizational solutions and improvements in the world. Challenges in Computer […]
 Educational Technology Infographics
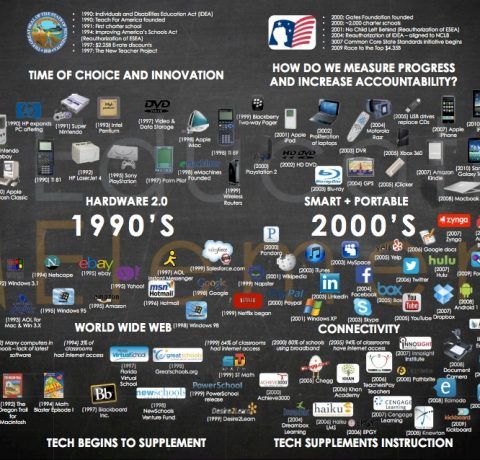
A Brief History of EdTech Infographic
Educational Technology Infographics
A Brief History of EdTech Infographic
Posted on January 30, 2014
Our students live in a very different world today than we did growing up. Technology has completely changed the way they play, learn, and interact with each other. As the adults who will help them navigate this world, it is our responsibility to understand these technologies and their effects. In order to do so, it […]
 Instructional Design Infographics
How to Present the Learning Objectives Infographic
Instructional Design Infographics
How to Present the Learning Objectives Infographic
Posted on January 28, 2014
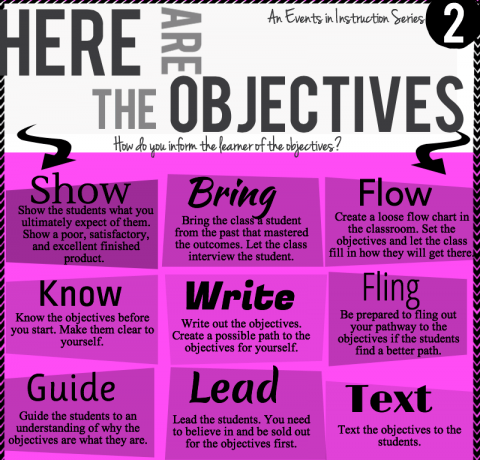
Robert Gagné proposed a model of nine events which follow a systematic instructional design process. Each of the nine events of instruction is highlighted in a series of infographics. The How to Present the Learning Objectives Infographic refers to Gagné’s 2nd event of instruction and presents ways teachers can inform their learners about the learning […]
 Instructional Design Infographics
How to Gain Students' Attention Infographic
Instructional Design Infographics
How to Gain Students' Attention Infographic
Posted on January 27, 2014
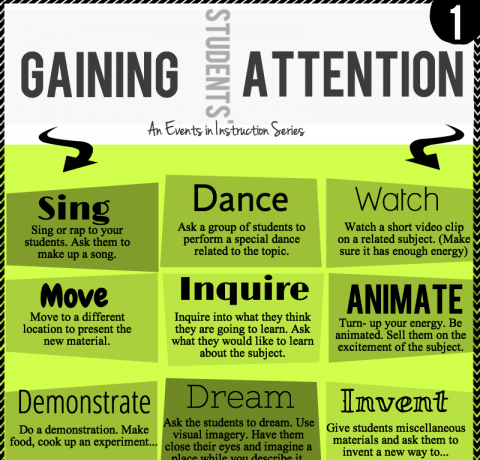
Robert Gagné proposed a model of nine events which follow a systematic instructional design process. Each of the nine events of instruction is highlighted in a series of infographics. The How to Gain Students' Attention Infographic refers to Gagné's 1st event of instruction and presents ways teachers can ensure that their learners are ready to […]
 Educational Technology Infographics
21st Century Educational Technology Classroom Infographic
Educational Technology Infographics
21st Century Educational Technology Classroom Infographic
Posted on January 25, 2014
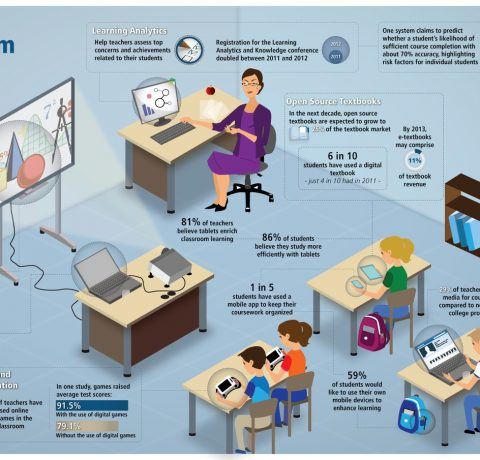
Technology is undeniably changing the face of education, and it's easy to see the impact already. Imagine what classrooms will be like in 20 years with the speed of technological innovation. At the 21st Century Educational Technology Classroom Infographic you will learn about some of the key advancements in the 21st century classroom. For a larger […]
 eLearning Infographics
North America E-Learning Market Infographic
eLearning Infographics
North America E-Learning Market Infographic
Posted on January 24, 2014
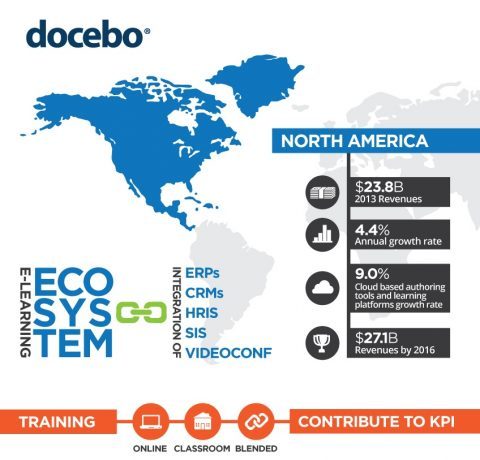
A great number of North American organizations are adopting learning technologies: see the Infographics to learn more about the latest E-Learning trends, and the Learning Management System market forecasts. 2013 taught us that the outcome of any learning initiative, whether blended, classroom based, or fully online must contribute to the organization’s KPIs and decision processes. […]
 Other Infographics
2014 Implementing the New Learning Agenda Infographic
Other Infographics
2014 Implementing the New Learning Agenda Infographic
Posted on January 21, 2014
Is your organization prepared for learning success in 2014? Use the Implementing the New Learning Agenda 2014 as a check list in your organization to help you become a top learning company. Data is taken from the 2013-14 Towards Maturity Benchmark where 540 participants from 44 countries contributed their perspectives on learning innovation and impact. […]
 Teacher Infographics
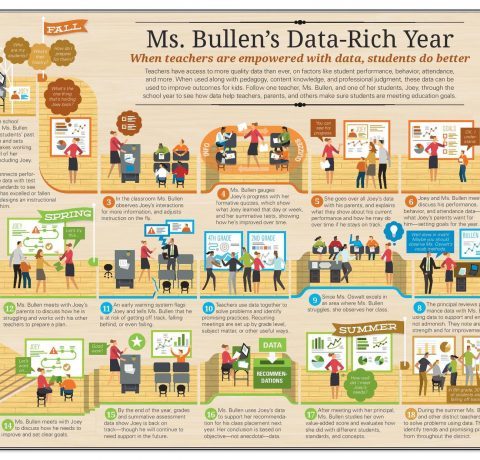
A Teacher's Data-Rich School Year Infographic
Teacher Infographics
A Teacher's Data-Rich School Year Infographic
Posted on January 10, 2014
Teachers have access to more quality data than ever, on factors like student performance, attendance, and more. When used along with pedagogy, content knowledge, and professional judgment, these data can be used responsibly to improve outcomes for kids. The Teacher's Data-Rich School Year Infographic follows a teacher and student through the school year to show […]
 Distance Education Infographics
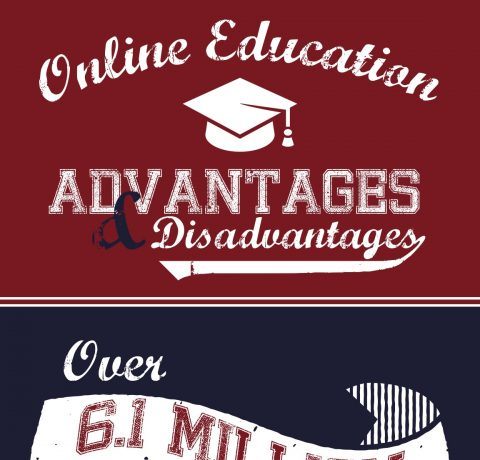
Advantages and Disadvantages of Online Education Infographic
Distance Education Infographics
Advantages and Disadvantages of Online Education Infographic
Posted on December 28, 2013
Over 6.1 Million students were taking at least one online course during the Fall 2010 term. )For more e-Learning statistics you are more than welcome to check the Top 10 eLearning Statistics for 2014 Infographic) So lets check the Advantages and Disadvantages of Online Education versus Traditional Education. 4 Advantages of Online Education Flexibility to […]
 Educational Technology Infographics
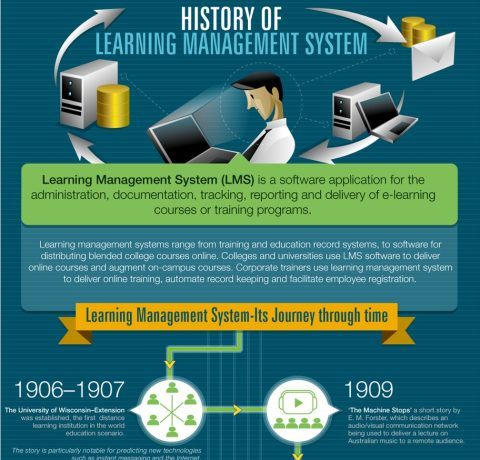
The History of Learning Management Systems Infographic
Educational Technology Infographics
The History of Learning Management Systems Infographic
Posted on December 28, 2013
From the very basic "problem cylinder", "KHUT", "SAKI" to Microsoft's Sharepoint Learning Kit and the powerfully simple ProProfs LMS, this inforgraphic tracks the incredible journey of Leaning Management Systems since it began in 1906, when University of Wisconsin was established as the first distance learning institution. For a larger printable version of the The History of […]