
How To Create Infographics That’ll Knock People’s Sock Off Infographic
A change is upon us. What this change is most visible in, is the way we communicate online. The entire face of communication is almost unrecognizable today. It seems that the way we communicate today – through Tweets, DMs, shares, pins, and likes has become part of our way of life. This change is not just relevant to words and platforms but also to visual communication. We have reached a stage where as marketers, we have to try and communicate with our target audience within a 6-second time frame, after which the marketing message is lost, as your target audiences’ attention has shifted to something else. That is why social visual platforms such as ‘Vine’ which communicates with 6-second videos captured on mobiles is so successful. That is why the creation and sharing of infographics have exploded in the last couple of years. These short attention spans require a communication that tells a story in as visual a format as possible.
Infographics are a visual representation of information, data, information, or knowledge. They are great ways to tell a story. Business owners have tons of information to share with their target audience and they should know how they can benefit from infographics. The information is provided to the user in a fun, visual and entertaining manner. The impact will be the same (if not more) but the medium is more attractive than say, a white paper or a case study.
Creating successful infographics
Infographics are formed out of a combination of images and text to create maximum impact. There are two basic tenets that lead to the success of an infographic:
- Great design
- Successful marketing and promotion
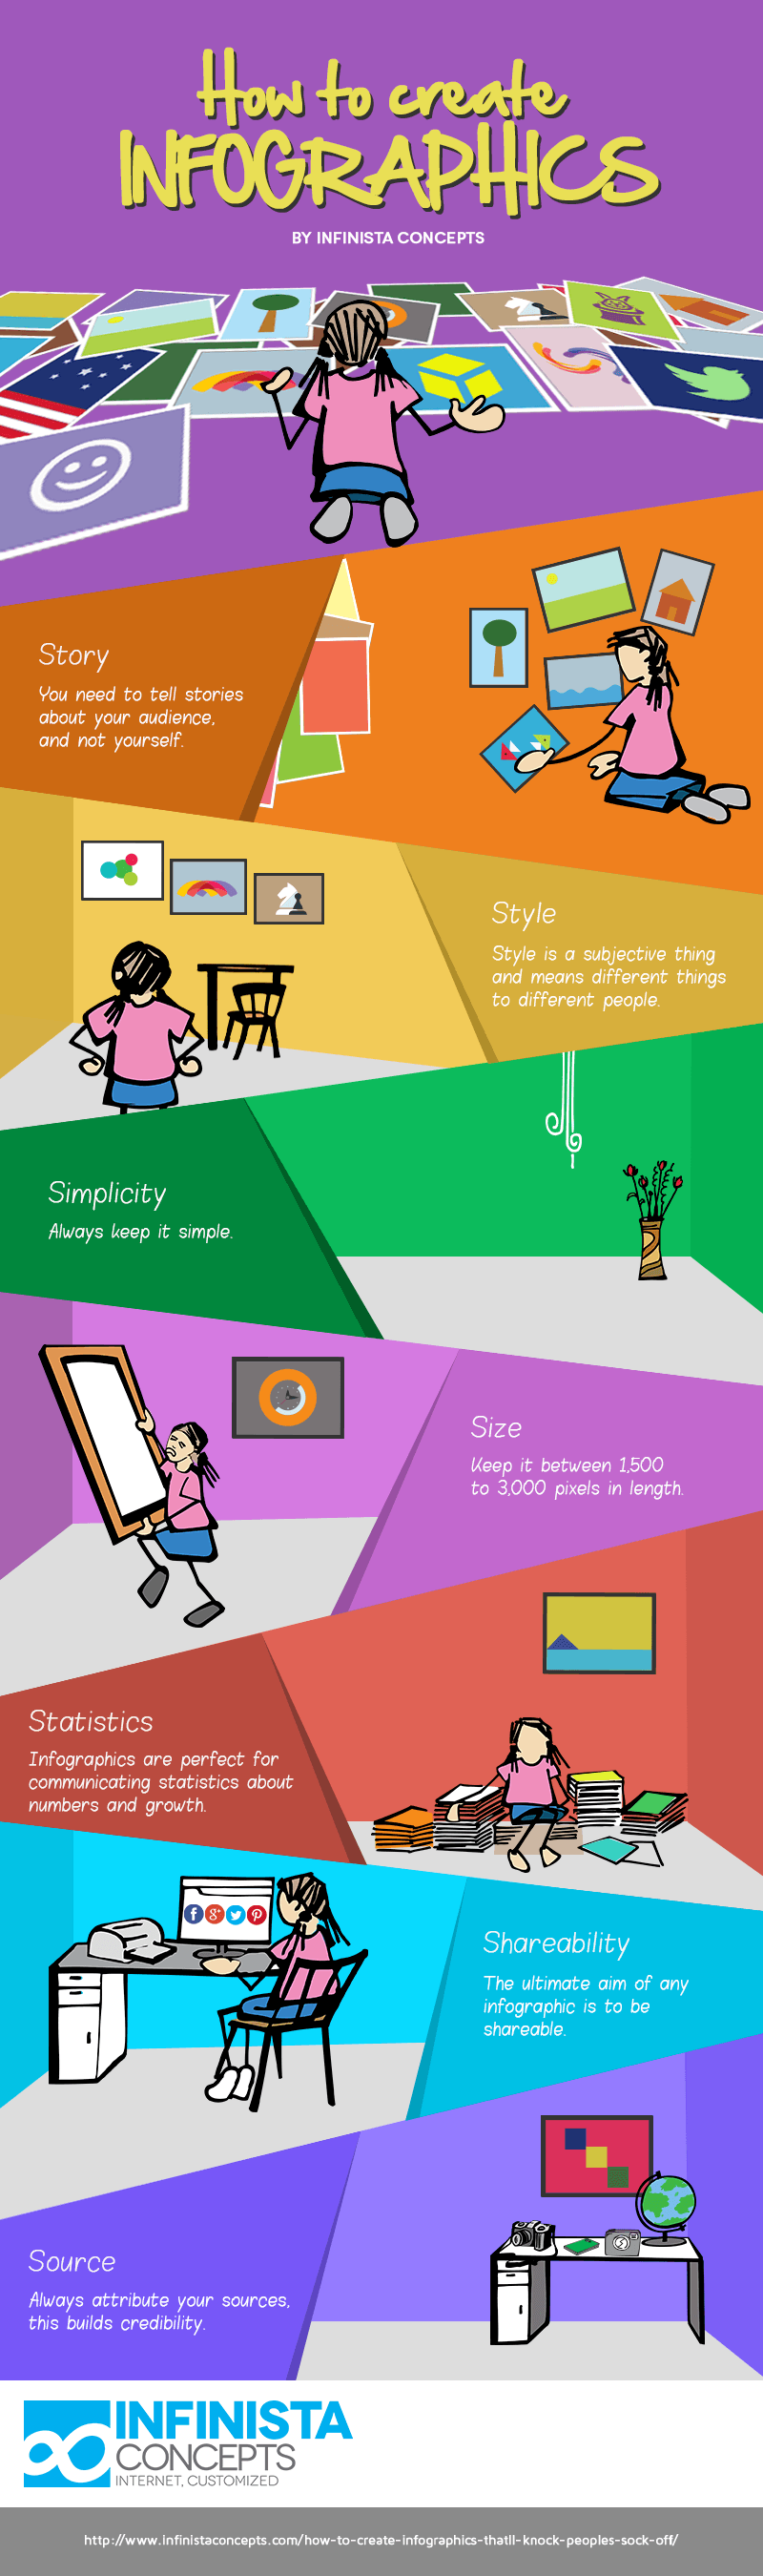
Designing an infographic that isn’t being promoted or marketed well is like creating the world’s greatest cheesecake, but never letting anyone taste it. Here are 7 elements to keep in mind while creating a successful infographic.
#1. Story
You need to tell stories about your audience, and not yourself. Find an area of interest that your target audience will find relevant and engaging. You can do this by paying attention to blog posts, keeping an eye on what gets shared the most and what kind of stuff seems to drives the most traffic.
#2. Style
Sure, style is a subjective thing and means different things to different people. But good designers just know from experience and from gut instinct, what works and what doesn’t. Clump your content into buckets so you can capture the most interesting stuff. Make sure its hierarchical and digestible. And remember, less is almost always more.
#3. Simplicity
Always, always keep it simple. Getting swayed by fancy typefaces, graphics and images is very easy. You have got to focus on avoiding clutter and confusion by creating flow and connection.
#4. Size
You don’t want your infographic taking a month of Sundays to download. This means that you have to optimize it by considering the number of pixels and also by the size of the file. You don’t want a lengthy infographic either. Keep it between 1,500 to 3,000 pixels in length.
#5. Statistics
Infographics are perfect for communicating statistics about numbers and growth. Make sure they are reliable, factual, helpful and current.
#6. Shareability
The ultimate aim of any infographic is to be shareable. It’s like that cheesecake we spoke about earlier. It won’t have any value unless you share it. In the same way, allow your infographic to be shared easily by providing embed codes. Don’t forget to let influencers and fans on social networks know your awesome new infographic too.
#7. Source
Always attribute your sources so that your audience knows where you got your facts and figures from. This builds credibility.


You can adjust your cookie preferences here.