
The Numbers Behind Special Education Infographic
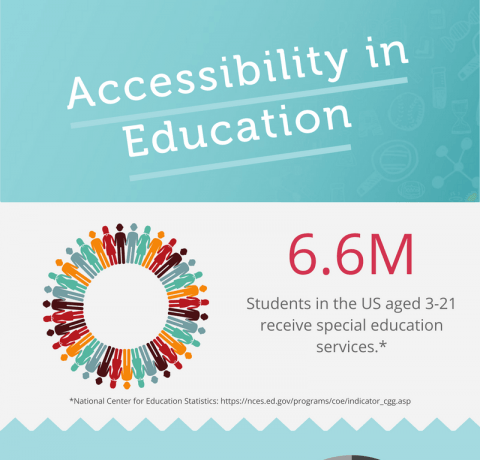
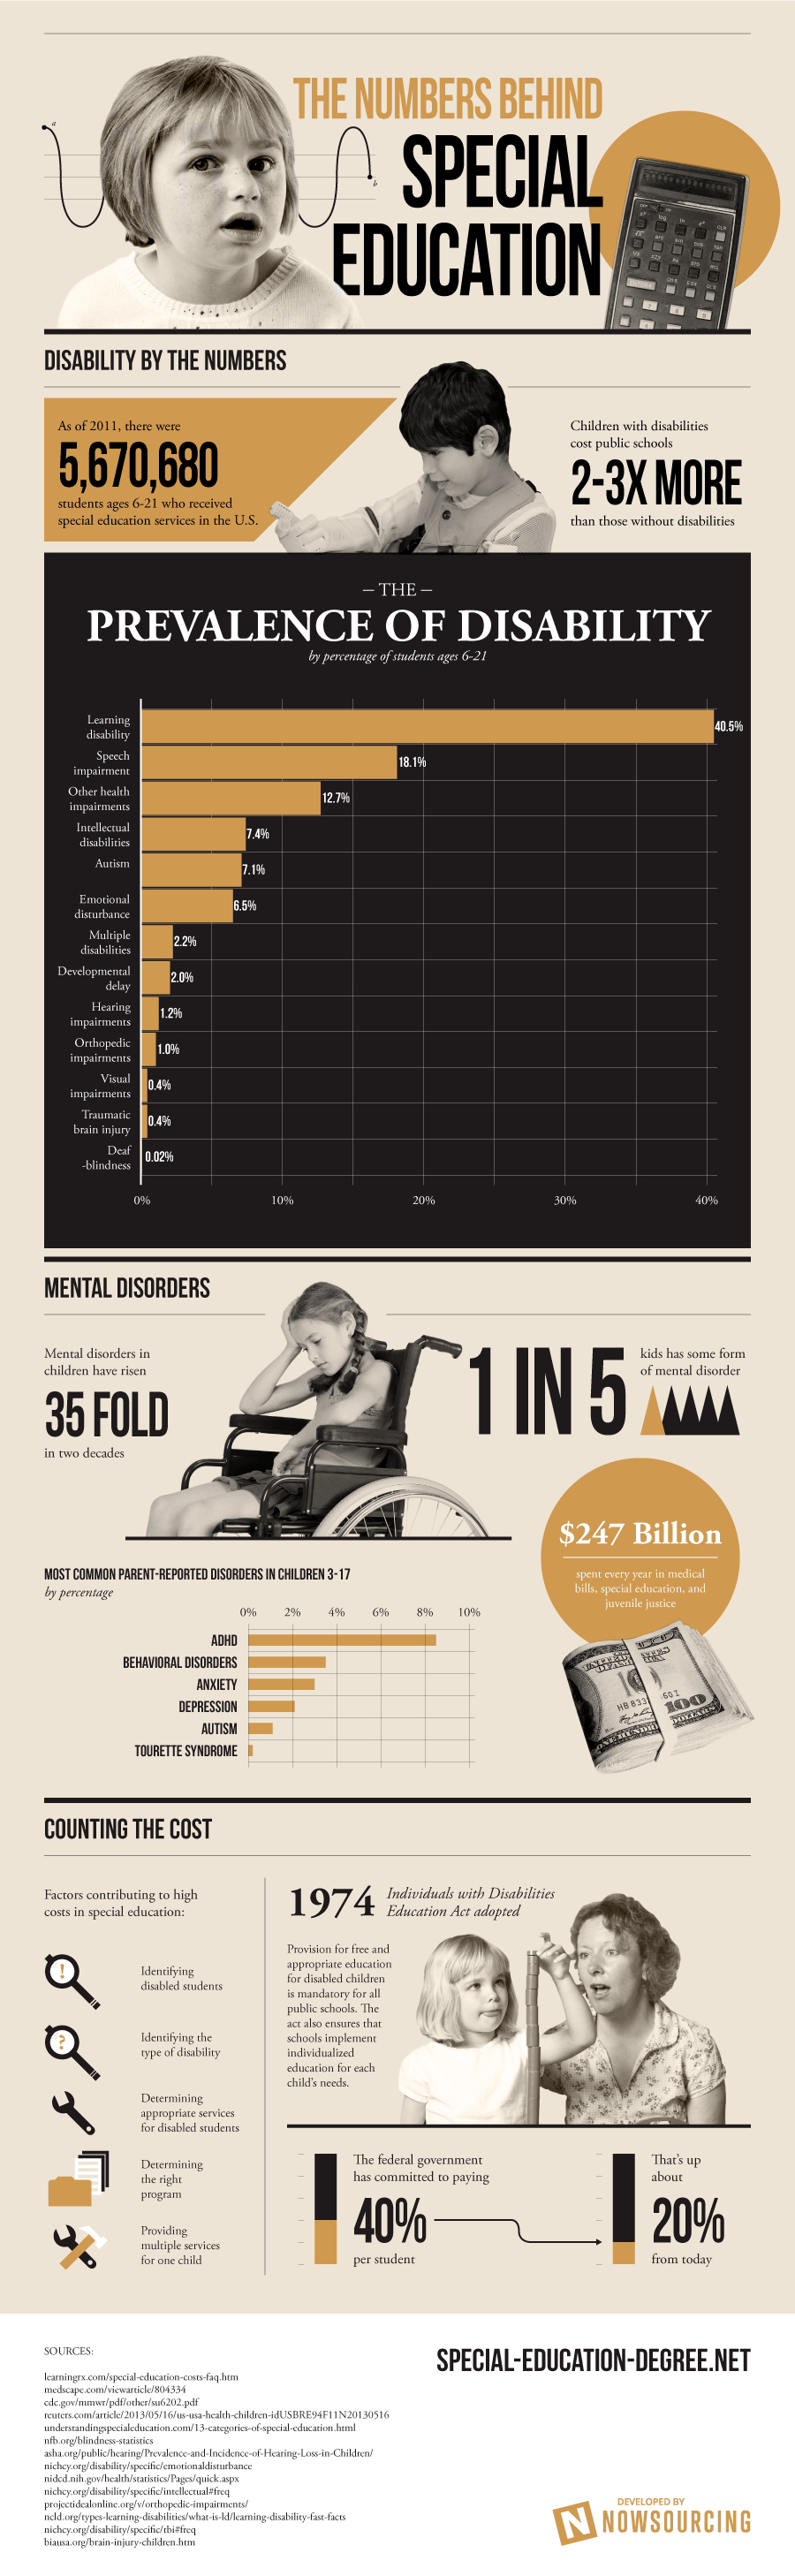
Take a look at The Numbers Behind Special Education Infographic for facts and stats on special education. Back in 1974, the Individuals with Disabilities Education Act was adopted. This act called for free and appropriate education for disabled children in all public schools. The acts also made sure that schools implemented individualized education for every child’s needs. As of 2011, there were 5,670,680 students aged six to twenty one who receives special education services in the United States. Kids with disabilities cost public schools two to three times more than students without disabilities, and many school districts are struggling to keep up. The process of identifying disabled students, the type of disability and the right services for each child takes time, manpower, and a lot of money. Today, children with learning, physical, and emotional disabilities are getting the education that they need and deserve.


You can adjust your cookie preferences here.