Learning Gap Infographic

elearninginfographics.com – The No.1 Source for the Best Blended Learning Infograpics
The Learning Gap Infographic

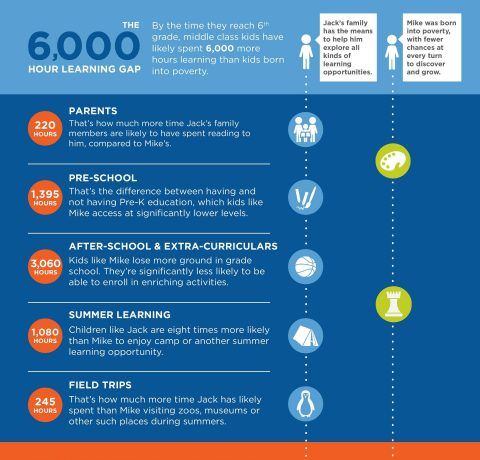
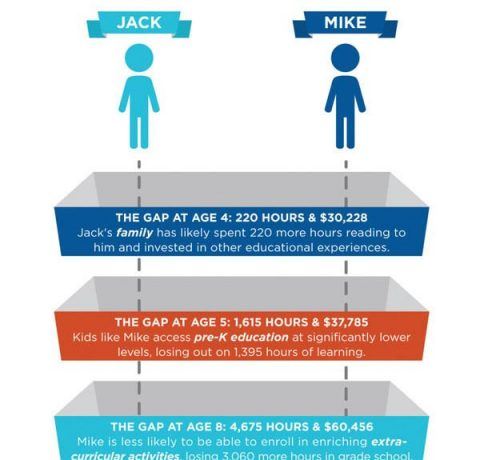
The Learning Gap Infographic presents the difference between learning hours spent of middle class kids and kids born into poverty. Middle class kids have likely spent 6,000 more hours learning than kids born into poverty. Parents - 220 hours Pre-school - 1,395 hours After-school and extra-curriculars - 3,060 hours Summer learning - 1,080 hours Field […]

How a Learning Gap Grows Infographic

Families of means are so determined to help their kids acquire skills for lifelong success that they'll spend what they can, opening up a skyrocketing gap between what parents in the top income bracket and those in the bottom spend on their kids' educational enrichment. As children grow, those gaps widen significantly. How a Learning […]