

Complexity and Depth of LMS Course Design Infographic
As technology-enhanced education continues to grow, teachers and administrators have access to more online data—data about course design, user interactions, and learning outcomes. Faced with all this data, it's tempting to dive in and start making comparisons between courses that tell us how technology is being used and help us ask better questions about teaching and learning. The Complexity and Depth of LMS Course Design Infographic looks at online course design in a new way, by thinking about similarities and differences in course designs, and compiling them into meaningful categories that allow for comparisons, so that we can test ideas about online course design "best practices."
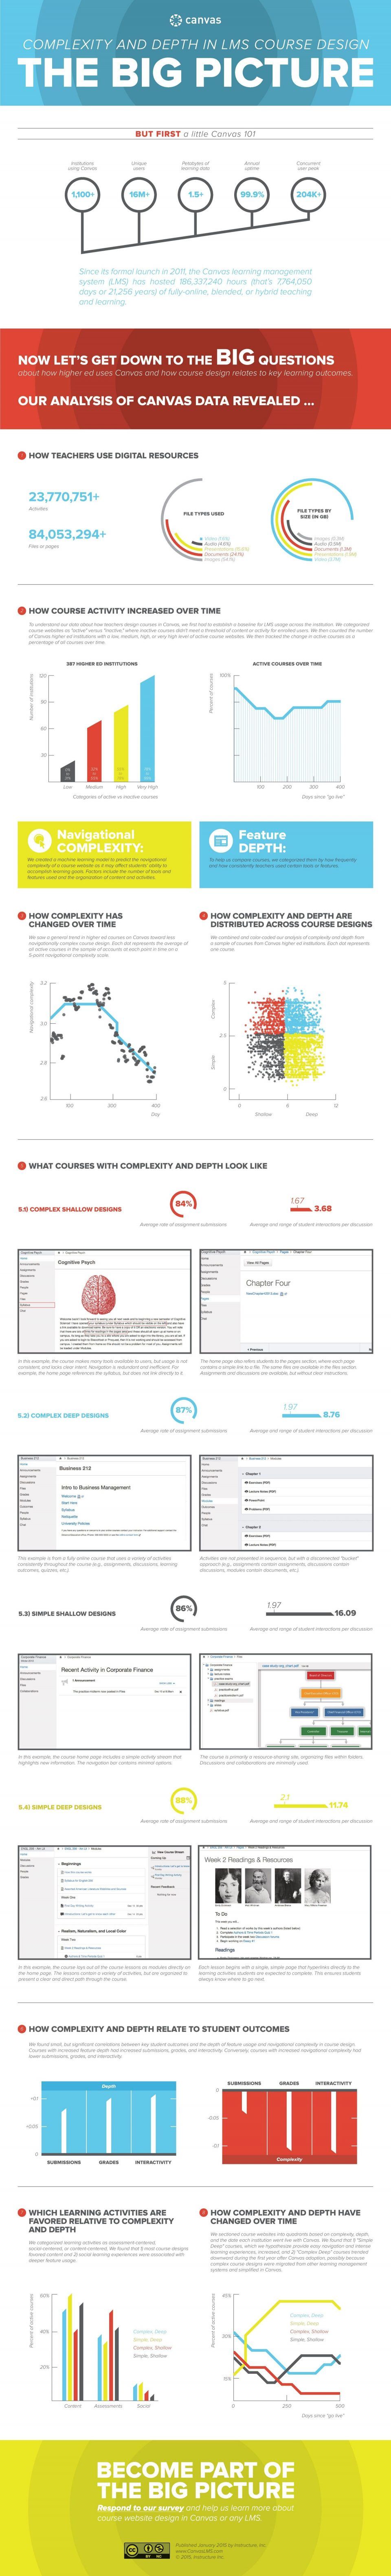
Canvas LMS 101
- 1,100+ Institutions using Canvas
- 16M+ Unique users
- 1.5+ Petabytes of learning data
- Annual uptime 99.9%
- 204K+ Concurrent user peak
Since its formal launch in 2011, the Canvas learning management system (LMS) has hosted 186,337,240 hours (that’s 7,764,050 days or 21,256 years) of fully-online, blended, or hybrid teaching and learning
How Teachers Use Digital Resources
- 23,770,751+ Activities
- 84,053,294+ Files or pages
File types used:
- Video (1.6%)
- Audio (4.6%)
- Presentations (15.6%)
- Documents (24.1%)
- Images (54.1%)
File types by size (in GB):
- Images (0.3M)
- Audio (0.5M)
- Documents (1.3M)
- Presentations (1.9M)
- Video (3.7M)
How Course Activity Increased Over Time
To understand our data about how teachers design courses in Canvas, we first had to establish a baseline for LMS usage across the institution. We categorized course websites as "active" versus "inactive," where inactive courses didn't meet a threshold of content or activity for enrolled users. We then counted the number of Canvas higher ed institutions with a low, medium, high, or very high level of active course websites. We then tracked the change in active courses as a percentage of all courses over time.
Navigational COMPLEXITY: We created a machine learning model to predict the navigational complexity of a course website as it may aect students’ ability to accomplish learning goals. Factors include the number of tools and features used and the organization of content and activities.
Feature DEPTH: To help us compare courses, we categorized them by how frequently and how consistently teachers used certain tools or features.
How Complexity Has Changed Over Time
We saw a general trend in higher ed courses on Canvas toward less navigationally complex course design. Each dot represents the average of all active courses in the sample of accounts at each point in time on a 5-point navigational complexity scale.
How Complexity and Depth Relate To Student Outcomes
We found small, but significant correlations between key student outcomes and the depth of feature usage and navigational complexity in course design. Courses with increased feature depth had increased submissions, grades, and interactivity. Conversely, courses with increased navigational complexity had lower submissions, grades, and interactivity.
Which Learning Activities are Favored Relative to Complexity and Depth
We categorized learning activities as assessment-centered, social-centered, or content-centered, We found that 1) most course designs favored content and 2) social learning experiences were associated with deeper feature usage.
How Complexity and Depth Have Changed Over Time
We sectioned course websites into quadrants based on complexity, depth, and the date each institution went live with Canvas. We found that 1) "Simple Deep" courses, which we hypothesize provide easy navigation and intense learning experiences, increased, and 2) “Complex Deep” courses trended downward during the first year after Canvas adoption, possibly because complex course designs were migrated from other learning management systems and simplified in Canvas.


You can adjust your cookie preferences here.