Search Results
How Much Data Is Generated Every Day?

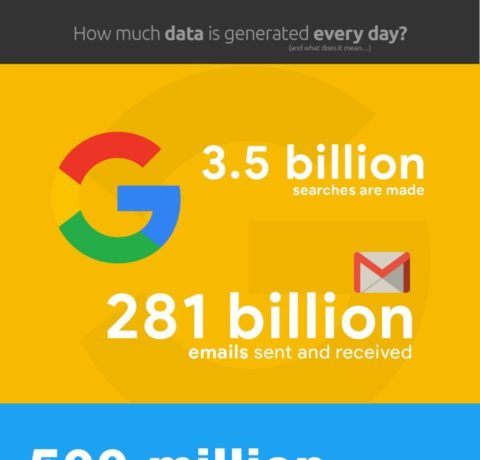
How Much Data Is Generated Every Day?—Infographic Vast amounts of data are generated online every day. Every search, every email, even every tweet and every YouTube video watched generates data that is shared, received, and stored. We have compiled the numbers and stats to understand the data generated every day through popular social media and […]

Student Data Privacy Guide

Student Data Privacy Guide—Infographic With the influx of EdTech tools, it's vital to protect your students' information online. Anything that can identify a student, whether standalone or combined with other information, is considered PII. From 2018 to 2019, cases of student data breaches involving PII tripled. Student data privacy laws only go so far to […]

Big Data In Cloud Infrastructure

Big Data In Cloud Infrastructure—Infographic The availability of data from every source imaginable is a game-changer for companies. Better known as Big Data in the business world, this large collection of data that is gathered, stored, organized and analyzed is key for business operations. Because of the enormity and sensitivity of such data sets, it's […]

Top 15 Big Data Trends And Predictions To Watch For In 2020

Top 15 Big Data Trends And Predictions To Watch For In 2020—Infographic The tech industry regularly sees the rise and fall of several hype cycles including the advent of the dot-com era to cloud computing, Big Data, and, more recently, Artificial Intelligence (AI) and blockchain. Here are the top 15 Big Data predictions that will […]

The Surprising Things You Don’t Know About Big Data

The Surprising Things You Don’t Know About Big Data—Infographic What is Big Data? Big Data includes data sets with sizes beyond the ability of commonly used software tools to capture, curate, manage, and process data within a tolerable elapsed time. The Past, Present, And Future Of Big Data 1. The Past Digital storage grew annually […]

3 Years Of Data: An Infographic On Corporate Gamification

3 Years Of Data: An Infographic On Corporate Gamification Gamification is a buzzword that gets thrown around a lot these days. At Trajectory IQ, we’ve worked with companies of all shapes and sizes over the past few years to create many different learning experiences for their employees. Some of the infographic highlights include the percentage […]

Big Data Is The Biggest Opportunity

Big Data Is The Biggest Opportunity - Infographic The skyrocketing fame of big data certifications is justified in today’s data-obsessed world. With businesses going bonkers over the benefits of gigantic bulks of data, the market for certifications in Big Data is ballooning at a lightning-quick pace. It is indeed, a golden era for phenomenal Big […]

25+ Essential Data-Driven Customer Service Tips Infographic

25+ Essential Data-Driven Customer Service Tips Infographic Customer service is a relatively new concept in the business atmosphere. With the innovation of business and technology, consumers now expect more care and attention from companies. It’s not just a transaction anymore, it’s a relationship. You can foster and maintain these relationships with your customers by tailoring […]

Differences Between Data Scientists And Data Analysts Infographic

Differences Between Data Scientists And Data Analysts Infographic A Data Scientist should have stronger data visualization skills and business acumen so that he can quickly convert data insights into a successful business story while a Data Analyst is responsible to convert data into meaningful business insights only. They are not expected to possess data visualization […]

Anatomy Of A Data Scientist Infographic

Anatomy Of A Data Scientist Infographic If you like working in the tech industry and you’re looking for a career that’s rewarding, sought after, has a high rate of employment, and gives you a lot of options of where you could work, becoming a data scientist may be right for you. The need for data […]

Using Data and Analysis in Higher Education Infographic

Using Data and Analysis in Higher Education Infographic For today’s educational leaders, one ongoing challenge is to provide a quality learning experience for students while keeping the price of tuition affordable. As institutional expenditures continue to rise, University and College leadership continue to look for ways to be fiscally efficient, while also providing a positive […]

Learn Data Science Infographic

Learn Data Science Infographic The stance towards data scientists has changed considerably over the past four years: in 2012, the majority of articles focused on trying to explain what a data scientist is and what they do exactly. Back then, a short search on Google on the words “How to become a data scientist” showed […]

Background image Background image
Stay up to date on the latest eLearning news, articles, and free resources sent straight to your inbox!
Free Subscription